Identify cracks in your parts. With semi-automatic crack segmentation, you can quantify cracks in your scans. By using multiple scans, you can compare these data sets and detect potential defects that can’t be seen with the naked eye. Indications can be characterised, for example, by their surface.
Visualize displacements between an initial and a deformed volume
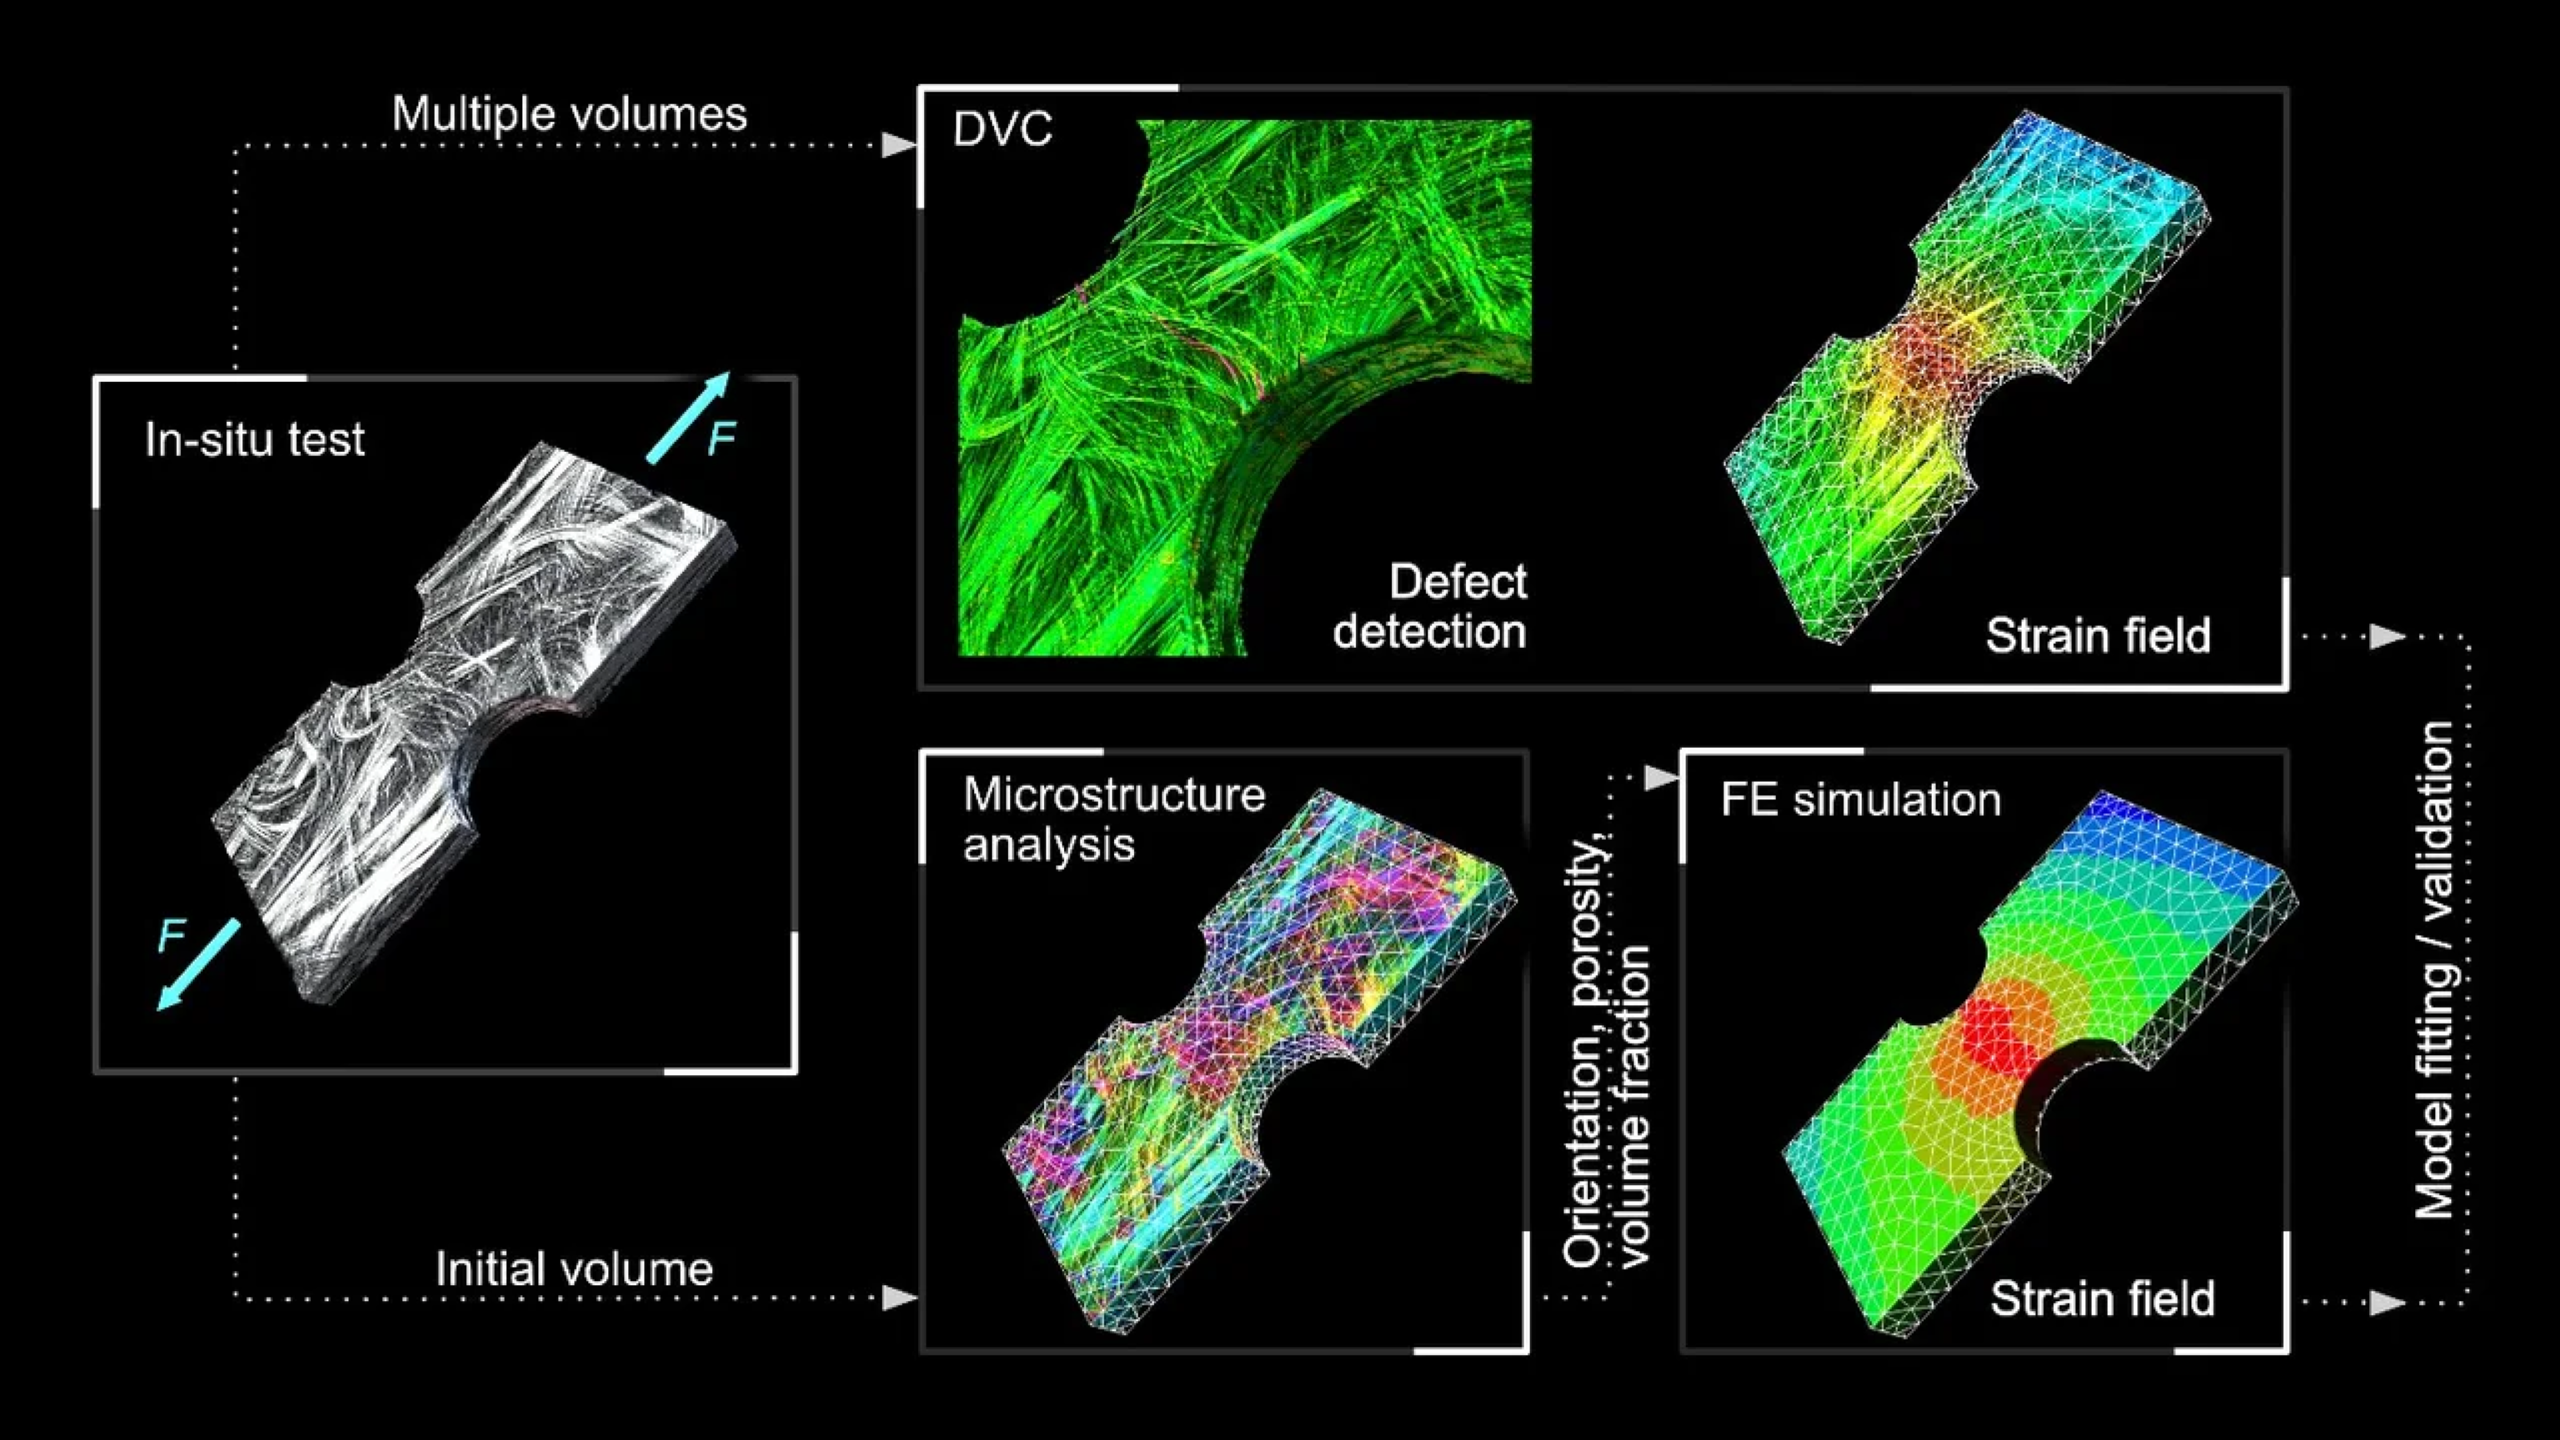
Digital volume correlation
- Correlates volumes at different states to calculate displacements and strains
- Allows you to investigate local strains to fit or validate material models in material science
- It is a powerful tool for damage detection in composite materials, enabling the investigation of small cracks by comparing gray values in two different states
- Matches material (e.g., bones) between different stages of life in the life sciences to study growth or other structural changes
- Offers two different correlation approaches to match volumes with the same image modality (e.g., two CT scans) or with different image modality (e.g., CT scan and MRI)
Investigating deformations: displacements and strains
Calculate and visualise displacements as well as strains.
With DVC, you can:
- Calculate local displacements from a non-linear transformation
- Visualise and measure local displacements in each coordinate direction, either component-wise or based on the displacement magnitude
- Visualise three-dimensional local strain tensors component-wise (xx, yy, zz, xy, xz,yz)
- Calculate von Mises strain and maximal, middle, and minimal principal strains

Visualise and measure local displacements

Visualise dimensional local strain tensor components
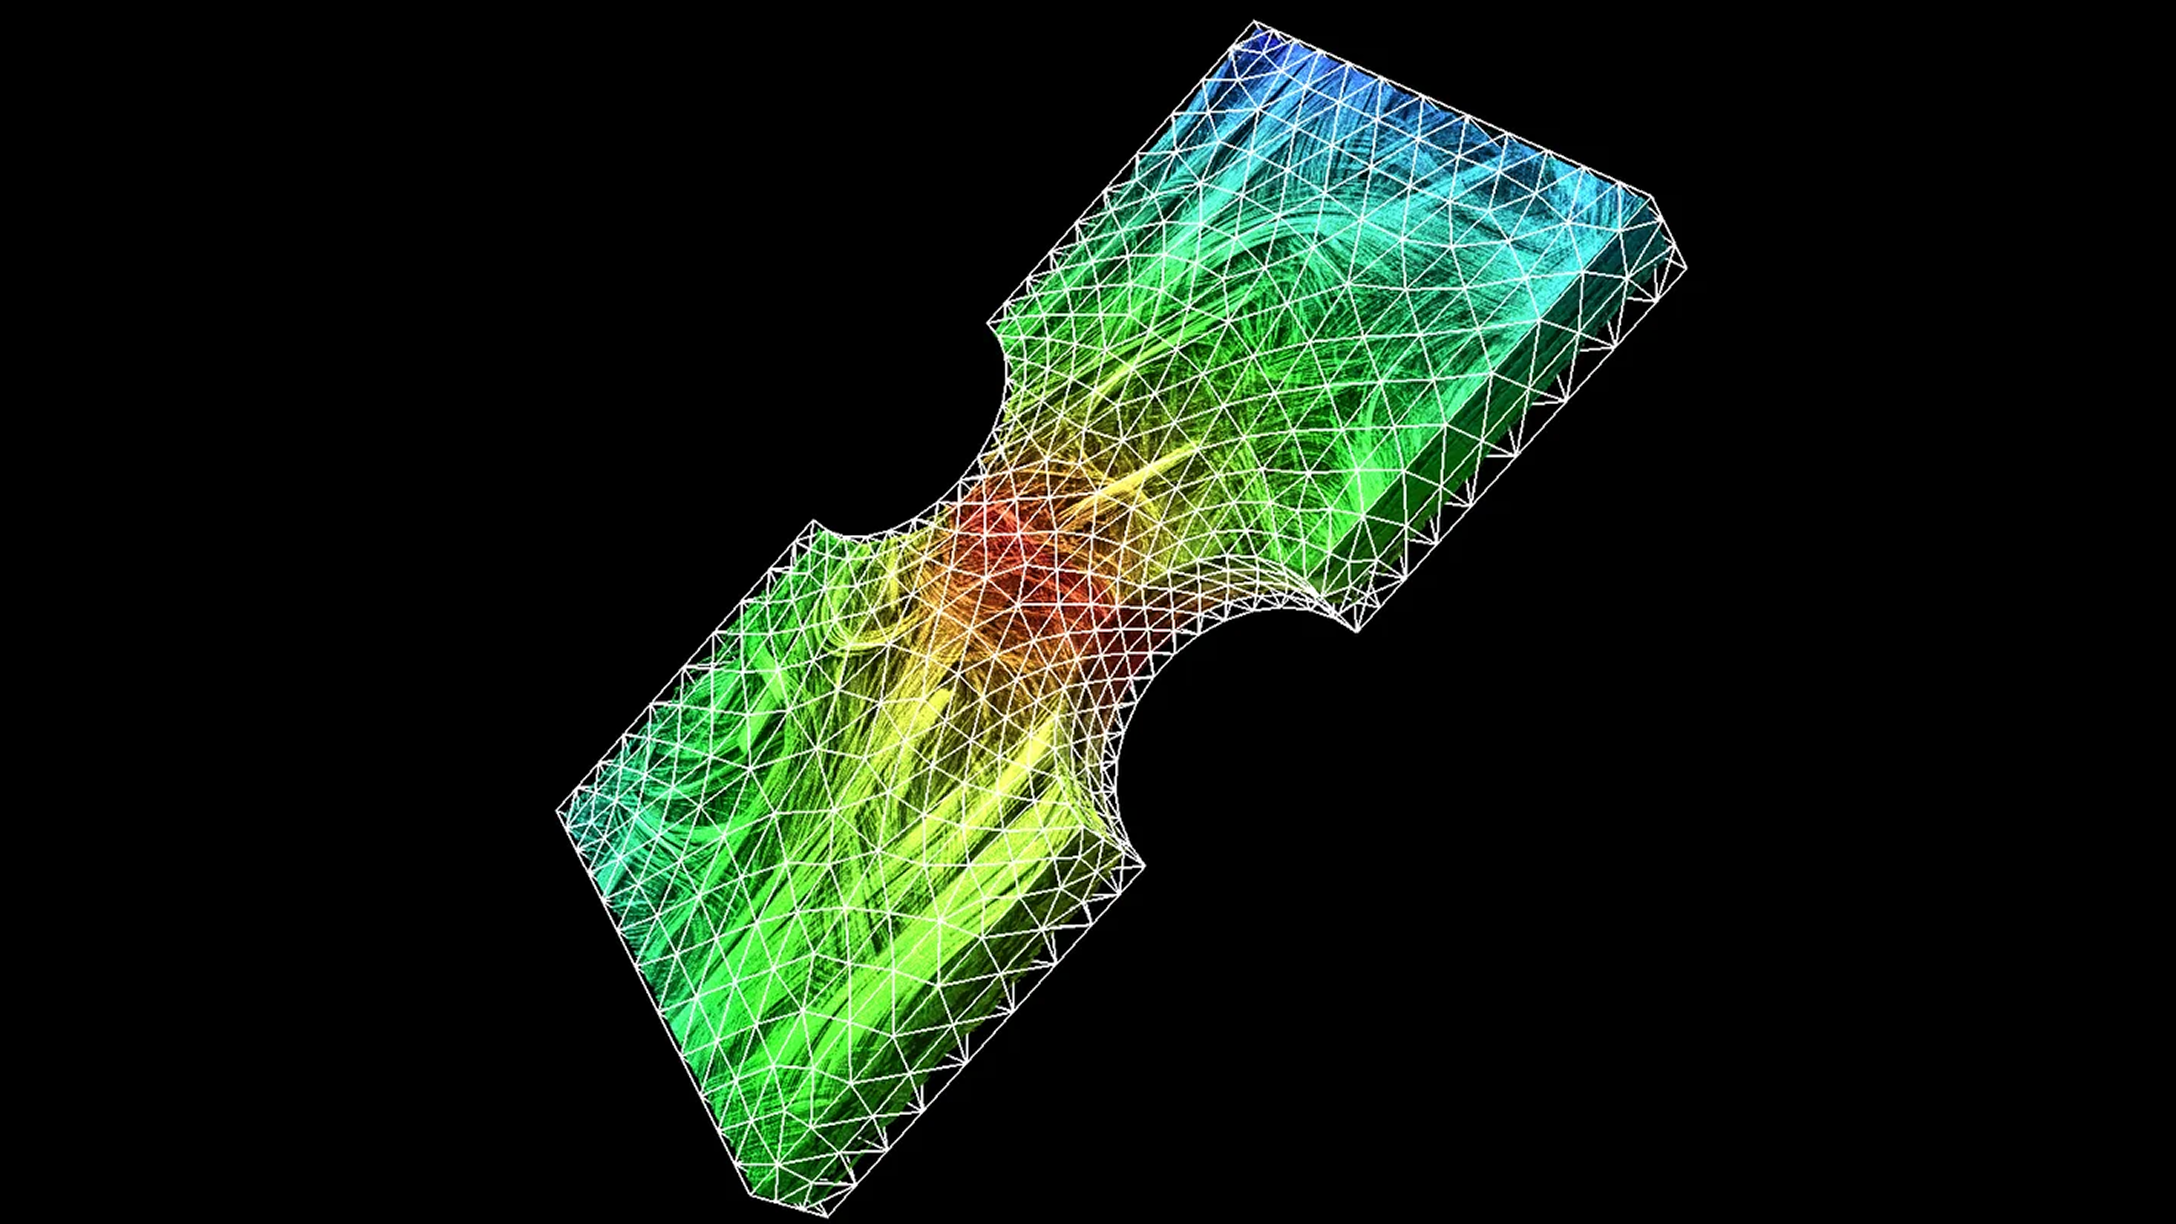
Results mapped on a mesh
Finite element (FE) meshes
To compare strains with simulation results or to fit material models, you can map local deformations or strains directly onto FE meshes. This makes VGSTUDIO MAX a powerful tool for material modeling.
With VGSTUDIO MAX, you can:
- Directly compare results with simulations
- Validate and improve material models
- Import Patran, NASTRAN, or Abaqus meshes to map strains on the same meshes used for simulation
- Quickly generate rectangular meshes to calculate average strains over a specific region and utilise the results in analytical models
- Map results onto meshes generated by the Volume Meshing function
- Map microstructural information, such as fibre orientation and fibre volume fraction, of the same sample onto the same mesh in a seamless workflow
Workflow for validation (or fitting) of material models

Displacement histogram
Histograms
All local features can be used to create local histograms for selected regions of interest or global histograms for the entire volume. Histograms enable you to examine the distribution of displacement and strain across the entire analysis region.
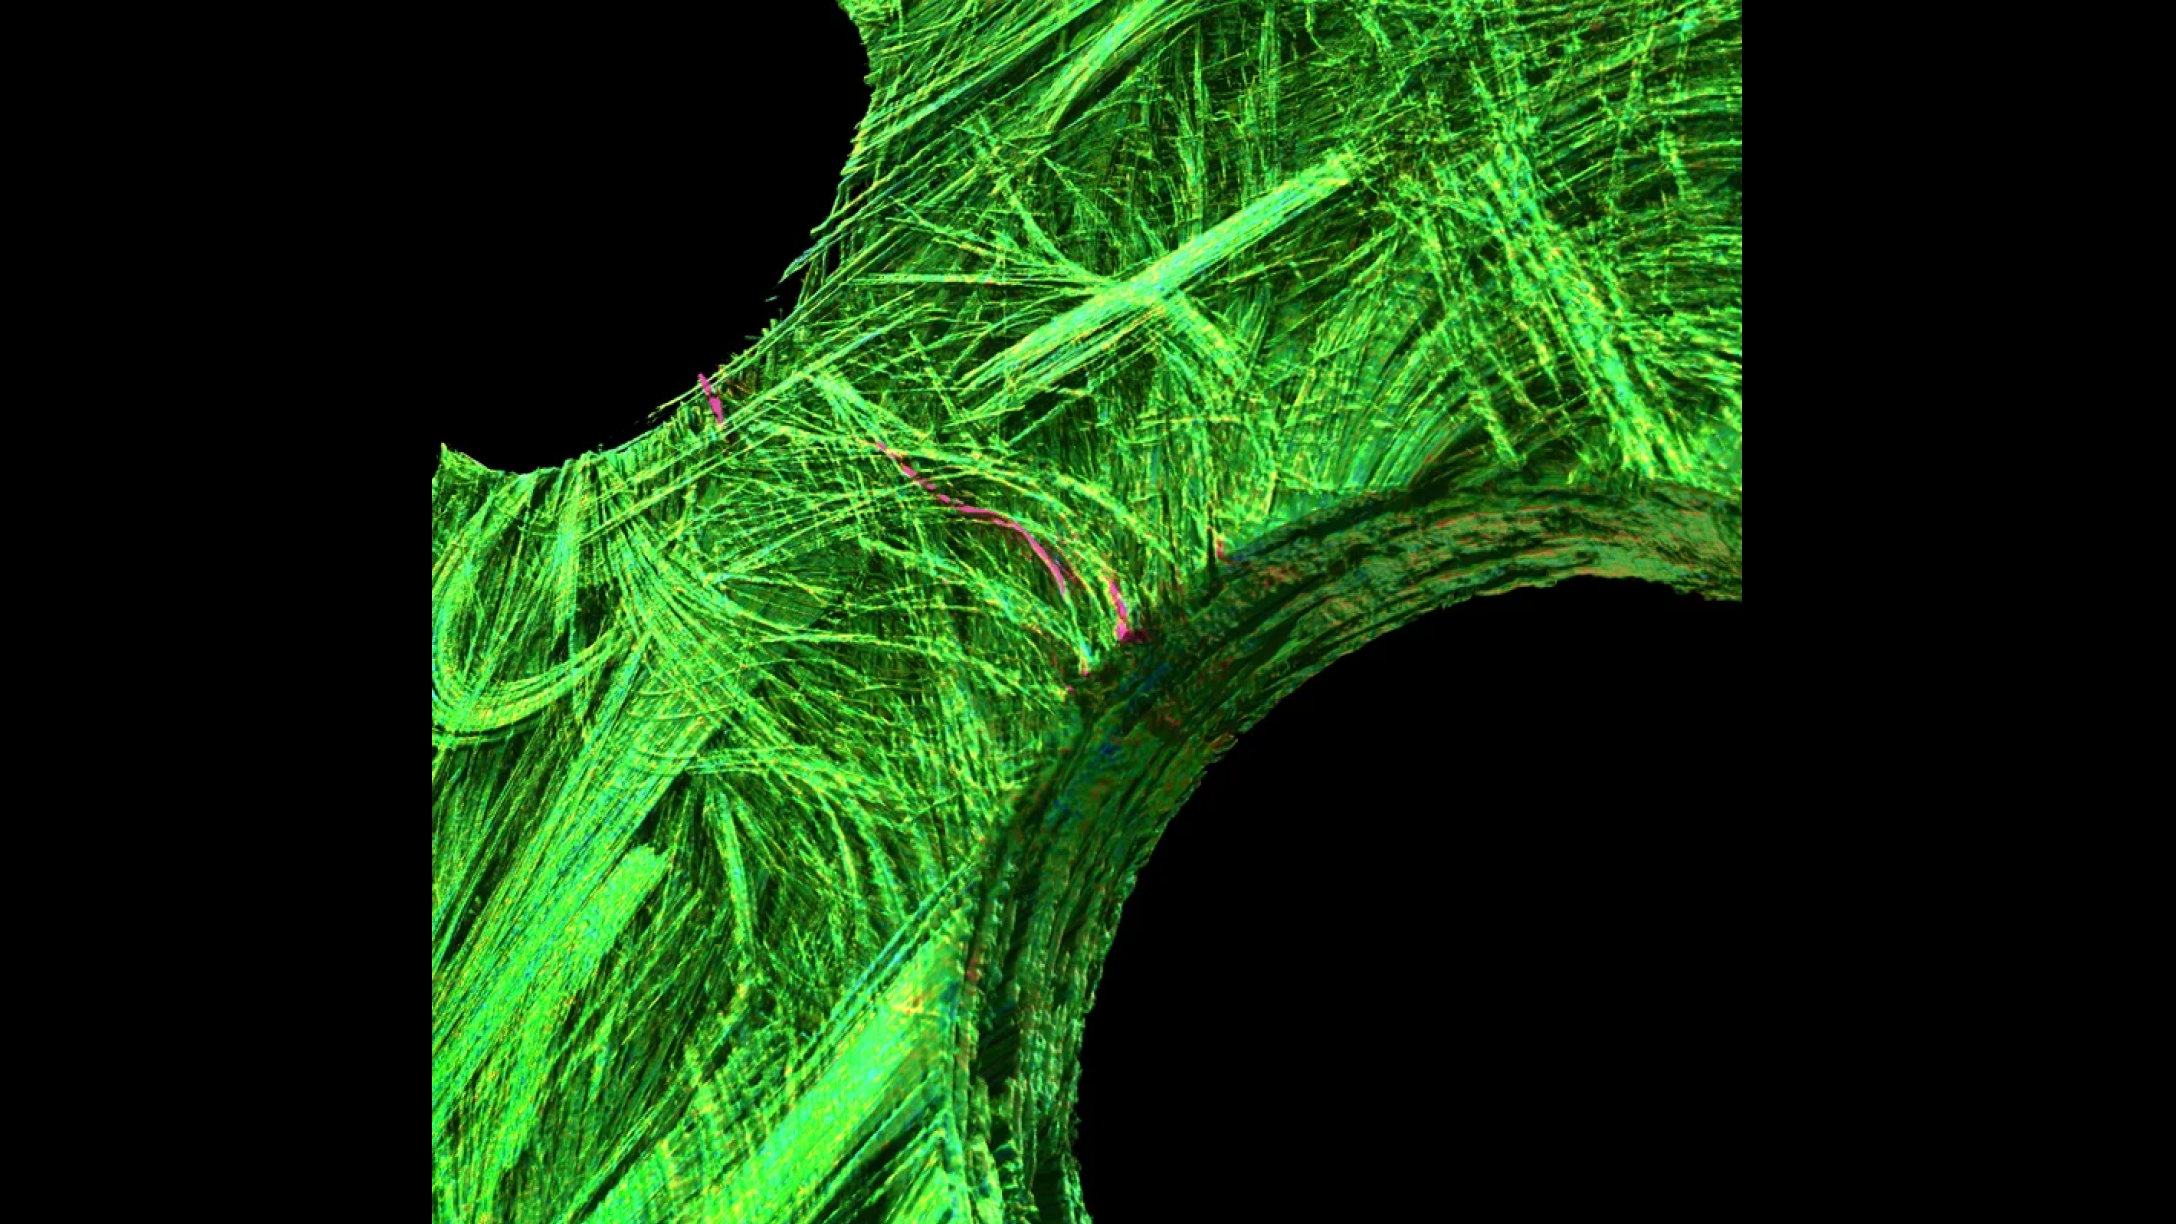
Crack visualised in red
Uncover defects
With DVC, you can:
- Detect indications invisible to the naked eye, such as cracks within the microstructure
- Separate and quantify these cracks by surface, volume, and shape and use the results for damage modeling
- Gain full information on the microstructure, including fibre orientation and volume fraction, from the undamaged sample using additional material analysis features available in VGSTUDIO MAX.
Accurately measure strain to validate material models for finite element (FE) simulations, ensuring your designs meet real-world demands. Detect even the smallest cracks between fibres, safeguarding the integrity of your components. Compare scans over time, identifying hidden damage and enhancing maintenance strategies.
Measure 3D displacement with subvoxel accuracy, capturing the finest details to enhance your analysis and decision-making processes. Even in low-contrast data sets, our software ensures accurate results, allowing you to trust the insights you gain and make confident decisions for your projects.
Graphical illustrations and tailored recommendations streamline the process of finding the optimal settings for your specific tasks, saving you time and effort. Effortlessly map DVC results onto your finite element (FE) meshes and export the data in a convenient .csv format. Create stunning visualisations with color overlays or displacement lines, transforming your data into clear, actionable insights.