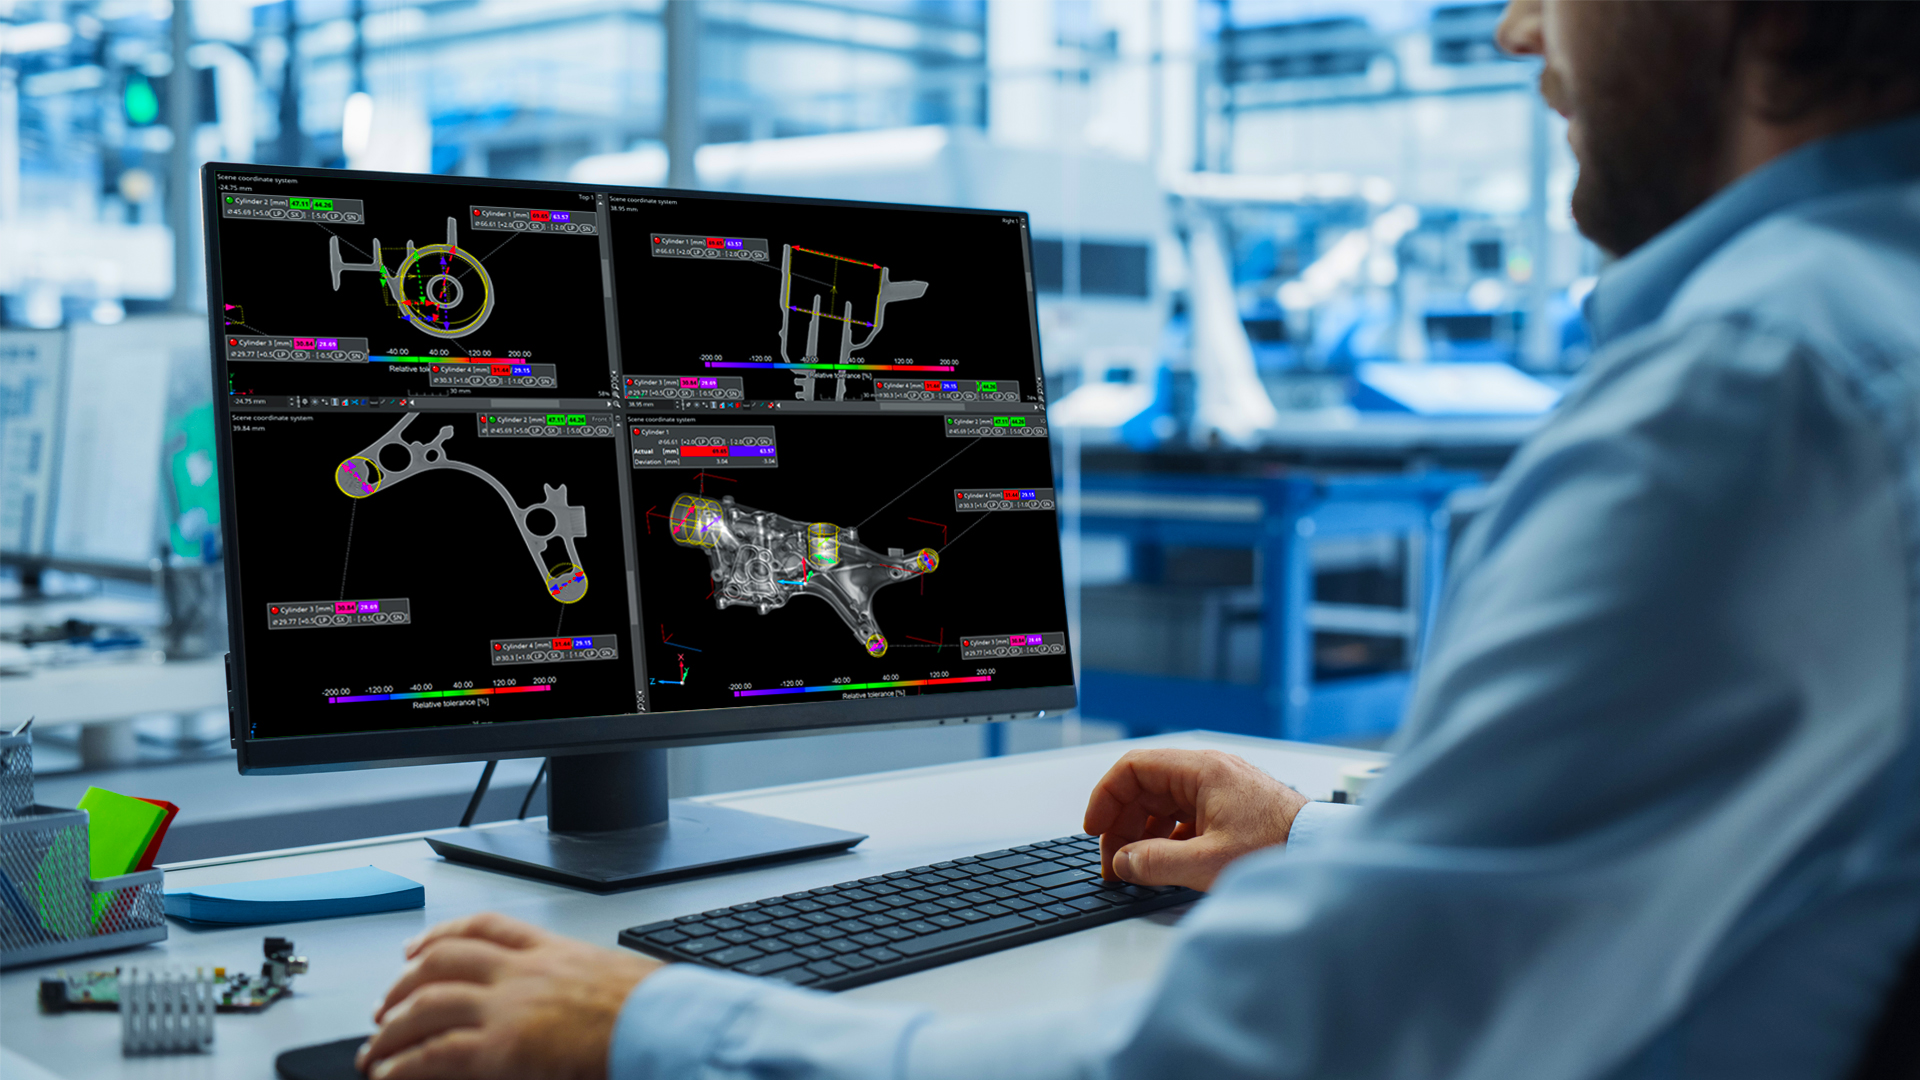
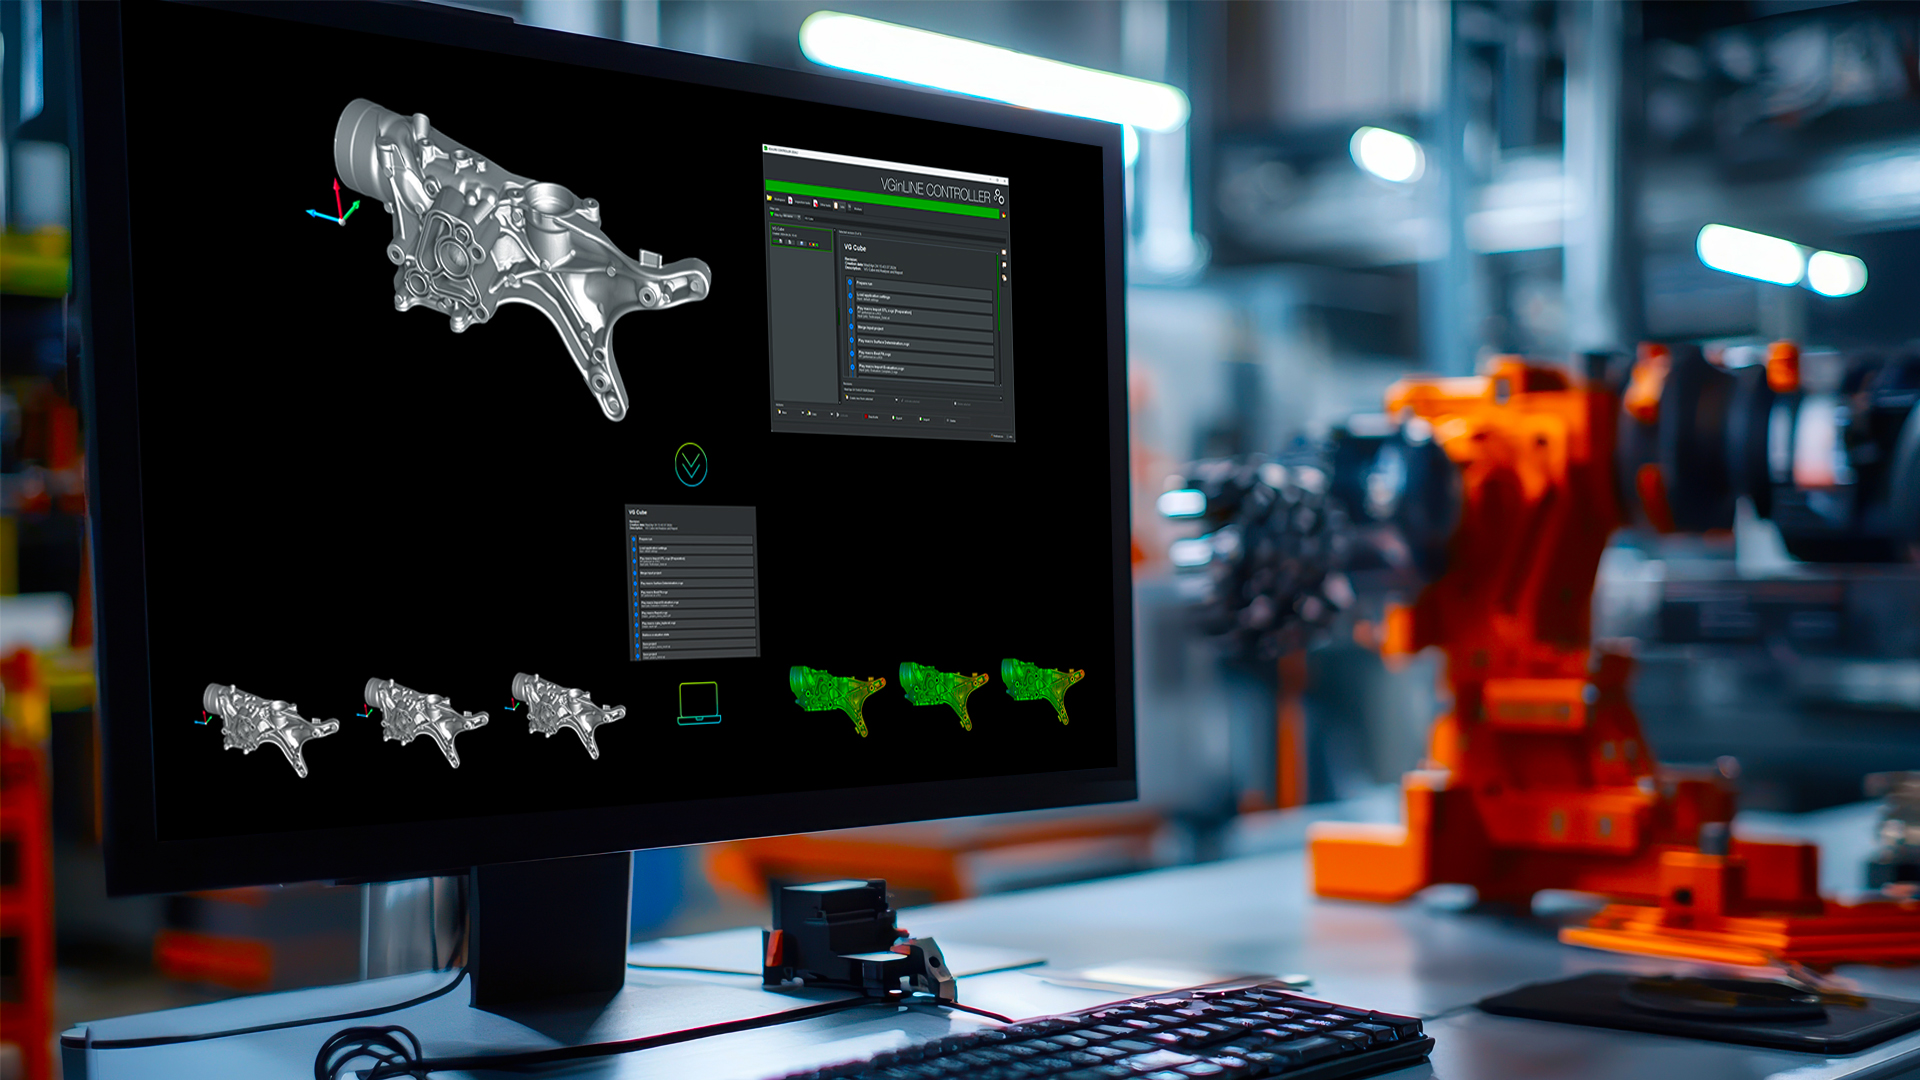
Automatically or semi-automatically inspect your parts with a recurring analysis pattern:
- Fully automated, in-line: 100% inspection in industrial production
- Fully or semi-automated, at-line: small batch series inspection in industrial production or quality labs
- Semi-automated: sample tests in quality labs or at service providers
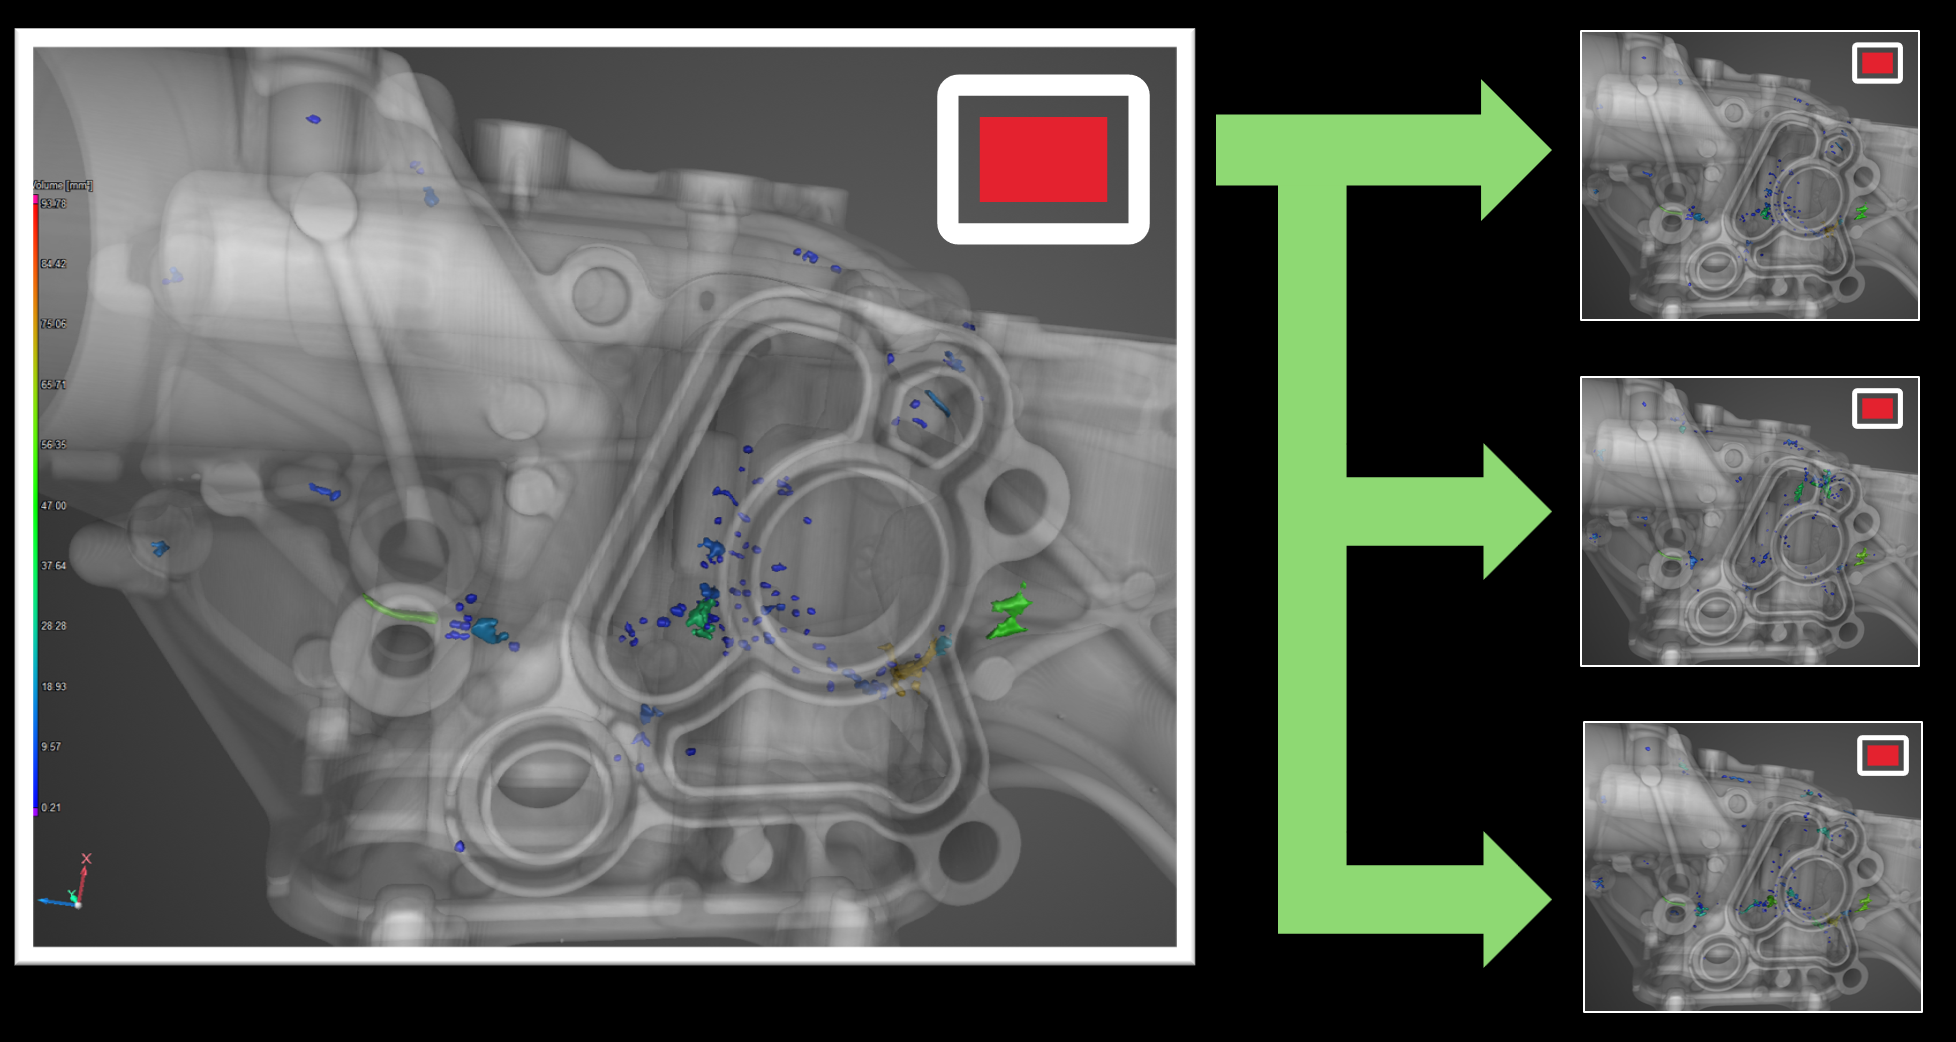
VGinLINE reconstructs incoming CT data sets efficiently on the fly. They do not need to be saved on a hard drive or reloaded. Outgoing data, such as statistics or analyses, is passed along to other software via built-in interfaces, including a Q-DAS interface to Quality Management software. An SDK opens up VGinLINE to external systems, such as a shop floor control system. Cavity markers in the CT scans can be recognised, stored, and used to select the corresponding inspection plan.
With VGinLINE, you always have total control of your system and your data.
You can easily configure and reconfigure VGinLINE, whether you need to adjust for minor changes to the product design or want to inspect a different product. Furthermore, it supports the Windows event log to log every relevant action to improve accountability and security. Access control to the system can be easily realised via the familiar Windows permission system, e.g., allowing only certain users to change configurations.
With jobs, you define what VGinLINE does with CT data sets.
- Use VGSTUDIO MAX to create macros and templates while drawing from the full scope of available analyses.*
- Build a new job from scratch by combining macros and templates, or duplicate and modify an existing job.
- In VGinLINE, if necessary, you can include if-then statements in your jobs—simply via drag and drop.
- To save time, you can tell the software to execute recurring steps within the inspection process only once.
- More important jobs will be calculated first based on your assigned priority.
- Our software assists you with setting up jobs and finding inconsistencies.
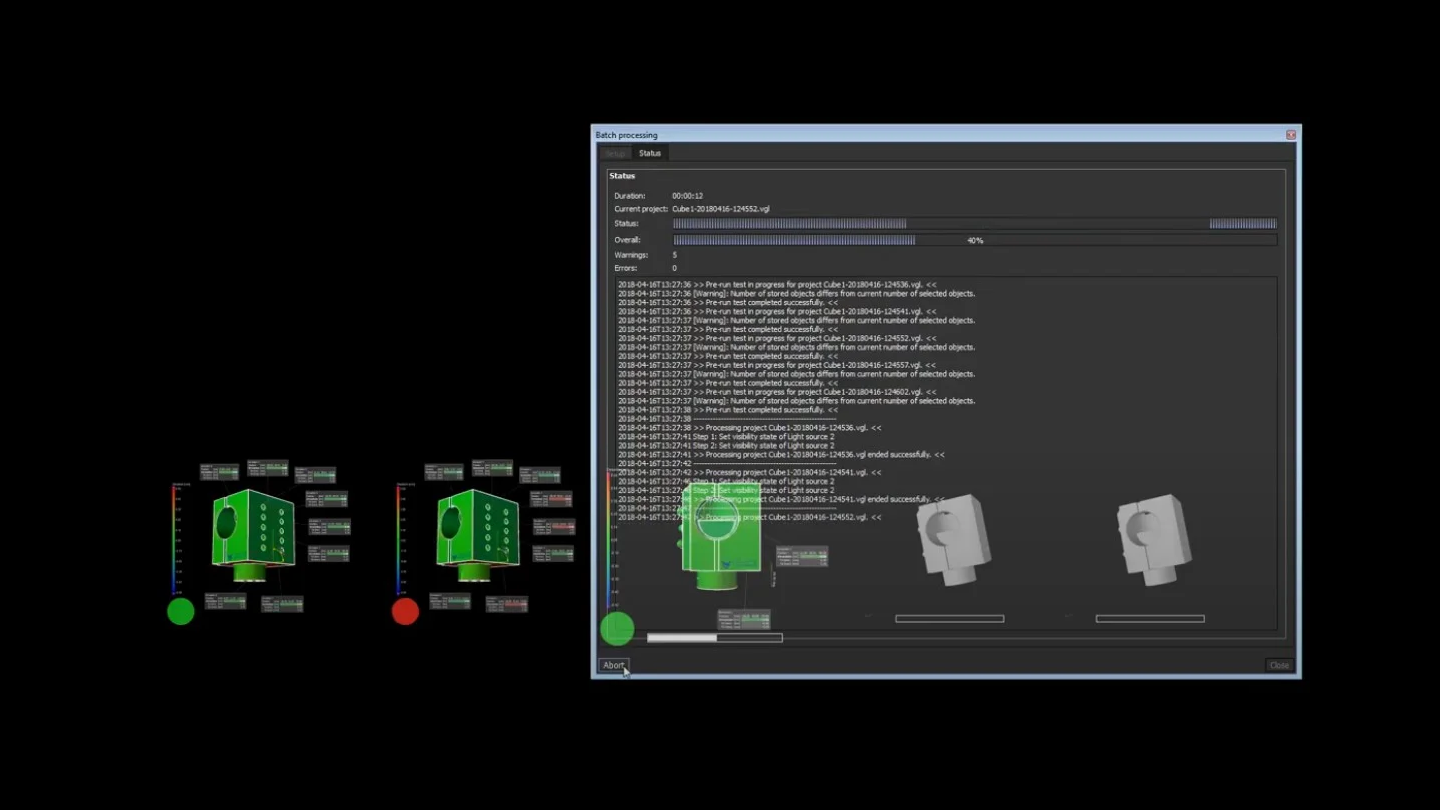
- If an inspection cannot be finished (e.g., because of a computer or network problem), VGinLINE ensures it will be processed again.
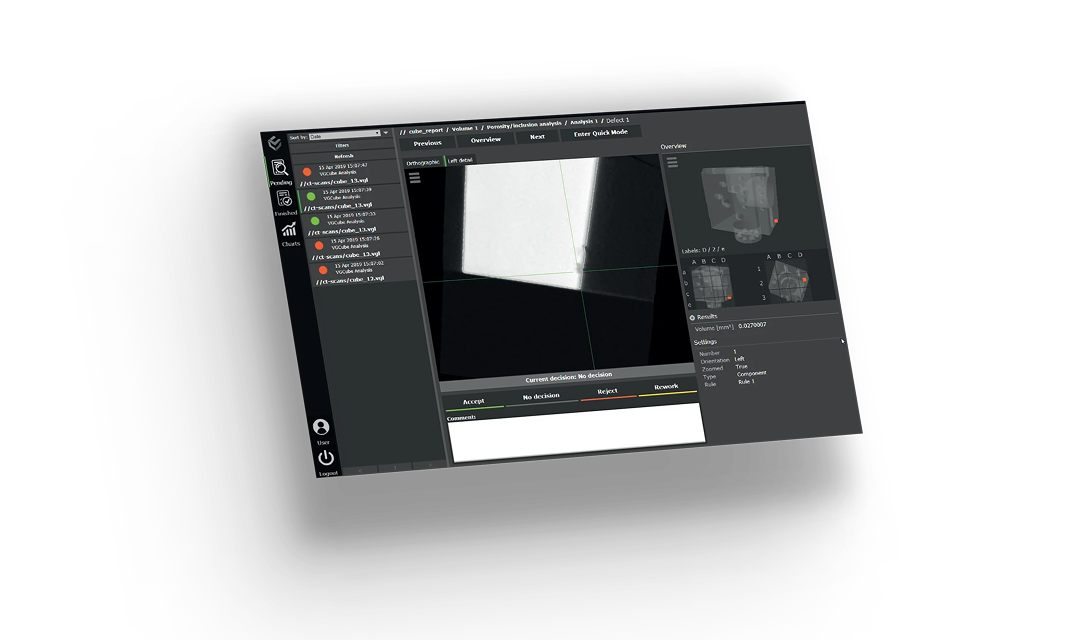
- The dashboard keeps you informed about the status of your inspections and the results for every part in real time.
* Depends on license
VGinLINE can export data for archiving purposes. The software ensures that this data is complete: For example, VGinLINE stores a CAD file that it used for inspection together with the result when exporting.
Read more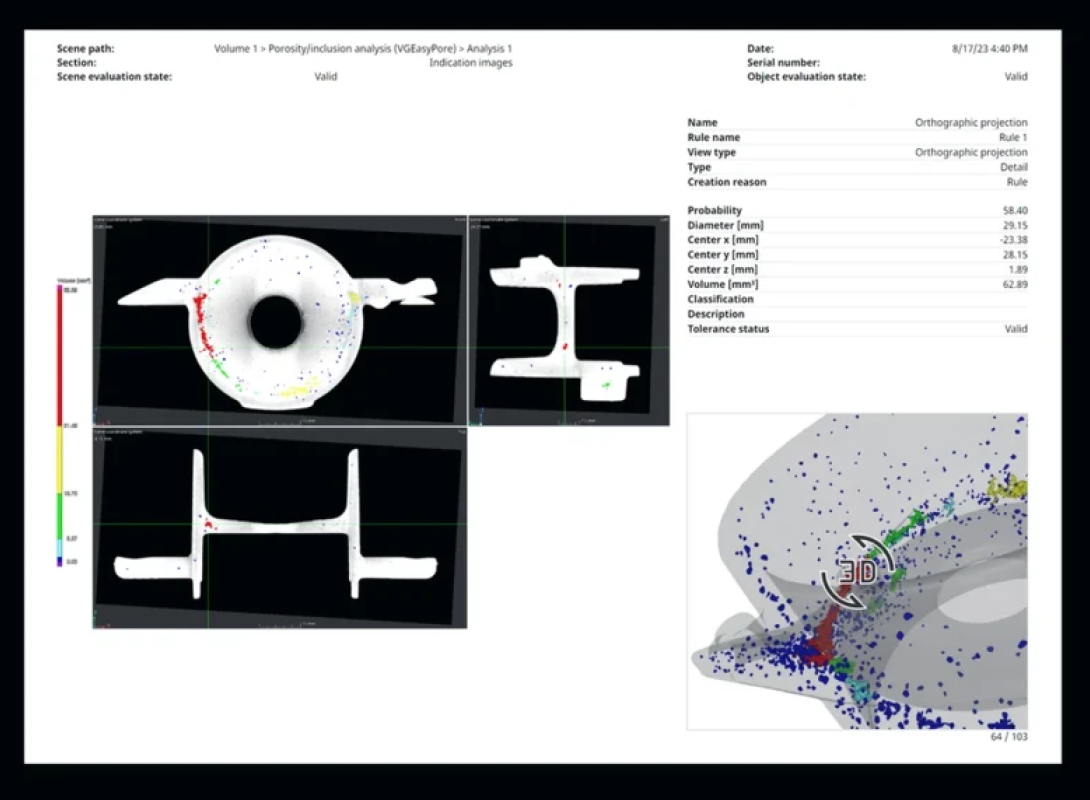
Get your free, 4-week trial license and see why we're the industry’s first and longest-trusted CT analysis software.
Request free trial
Create reports in DIN A4 or letter format — in portrait or landscape orientation.
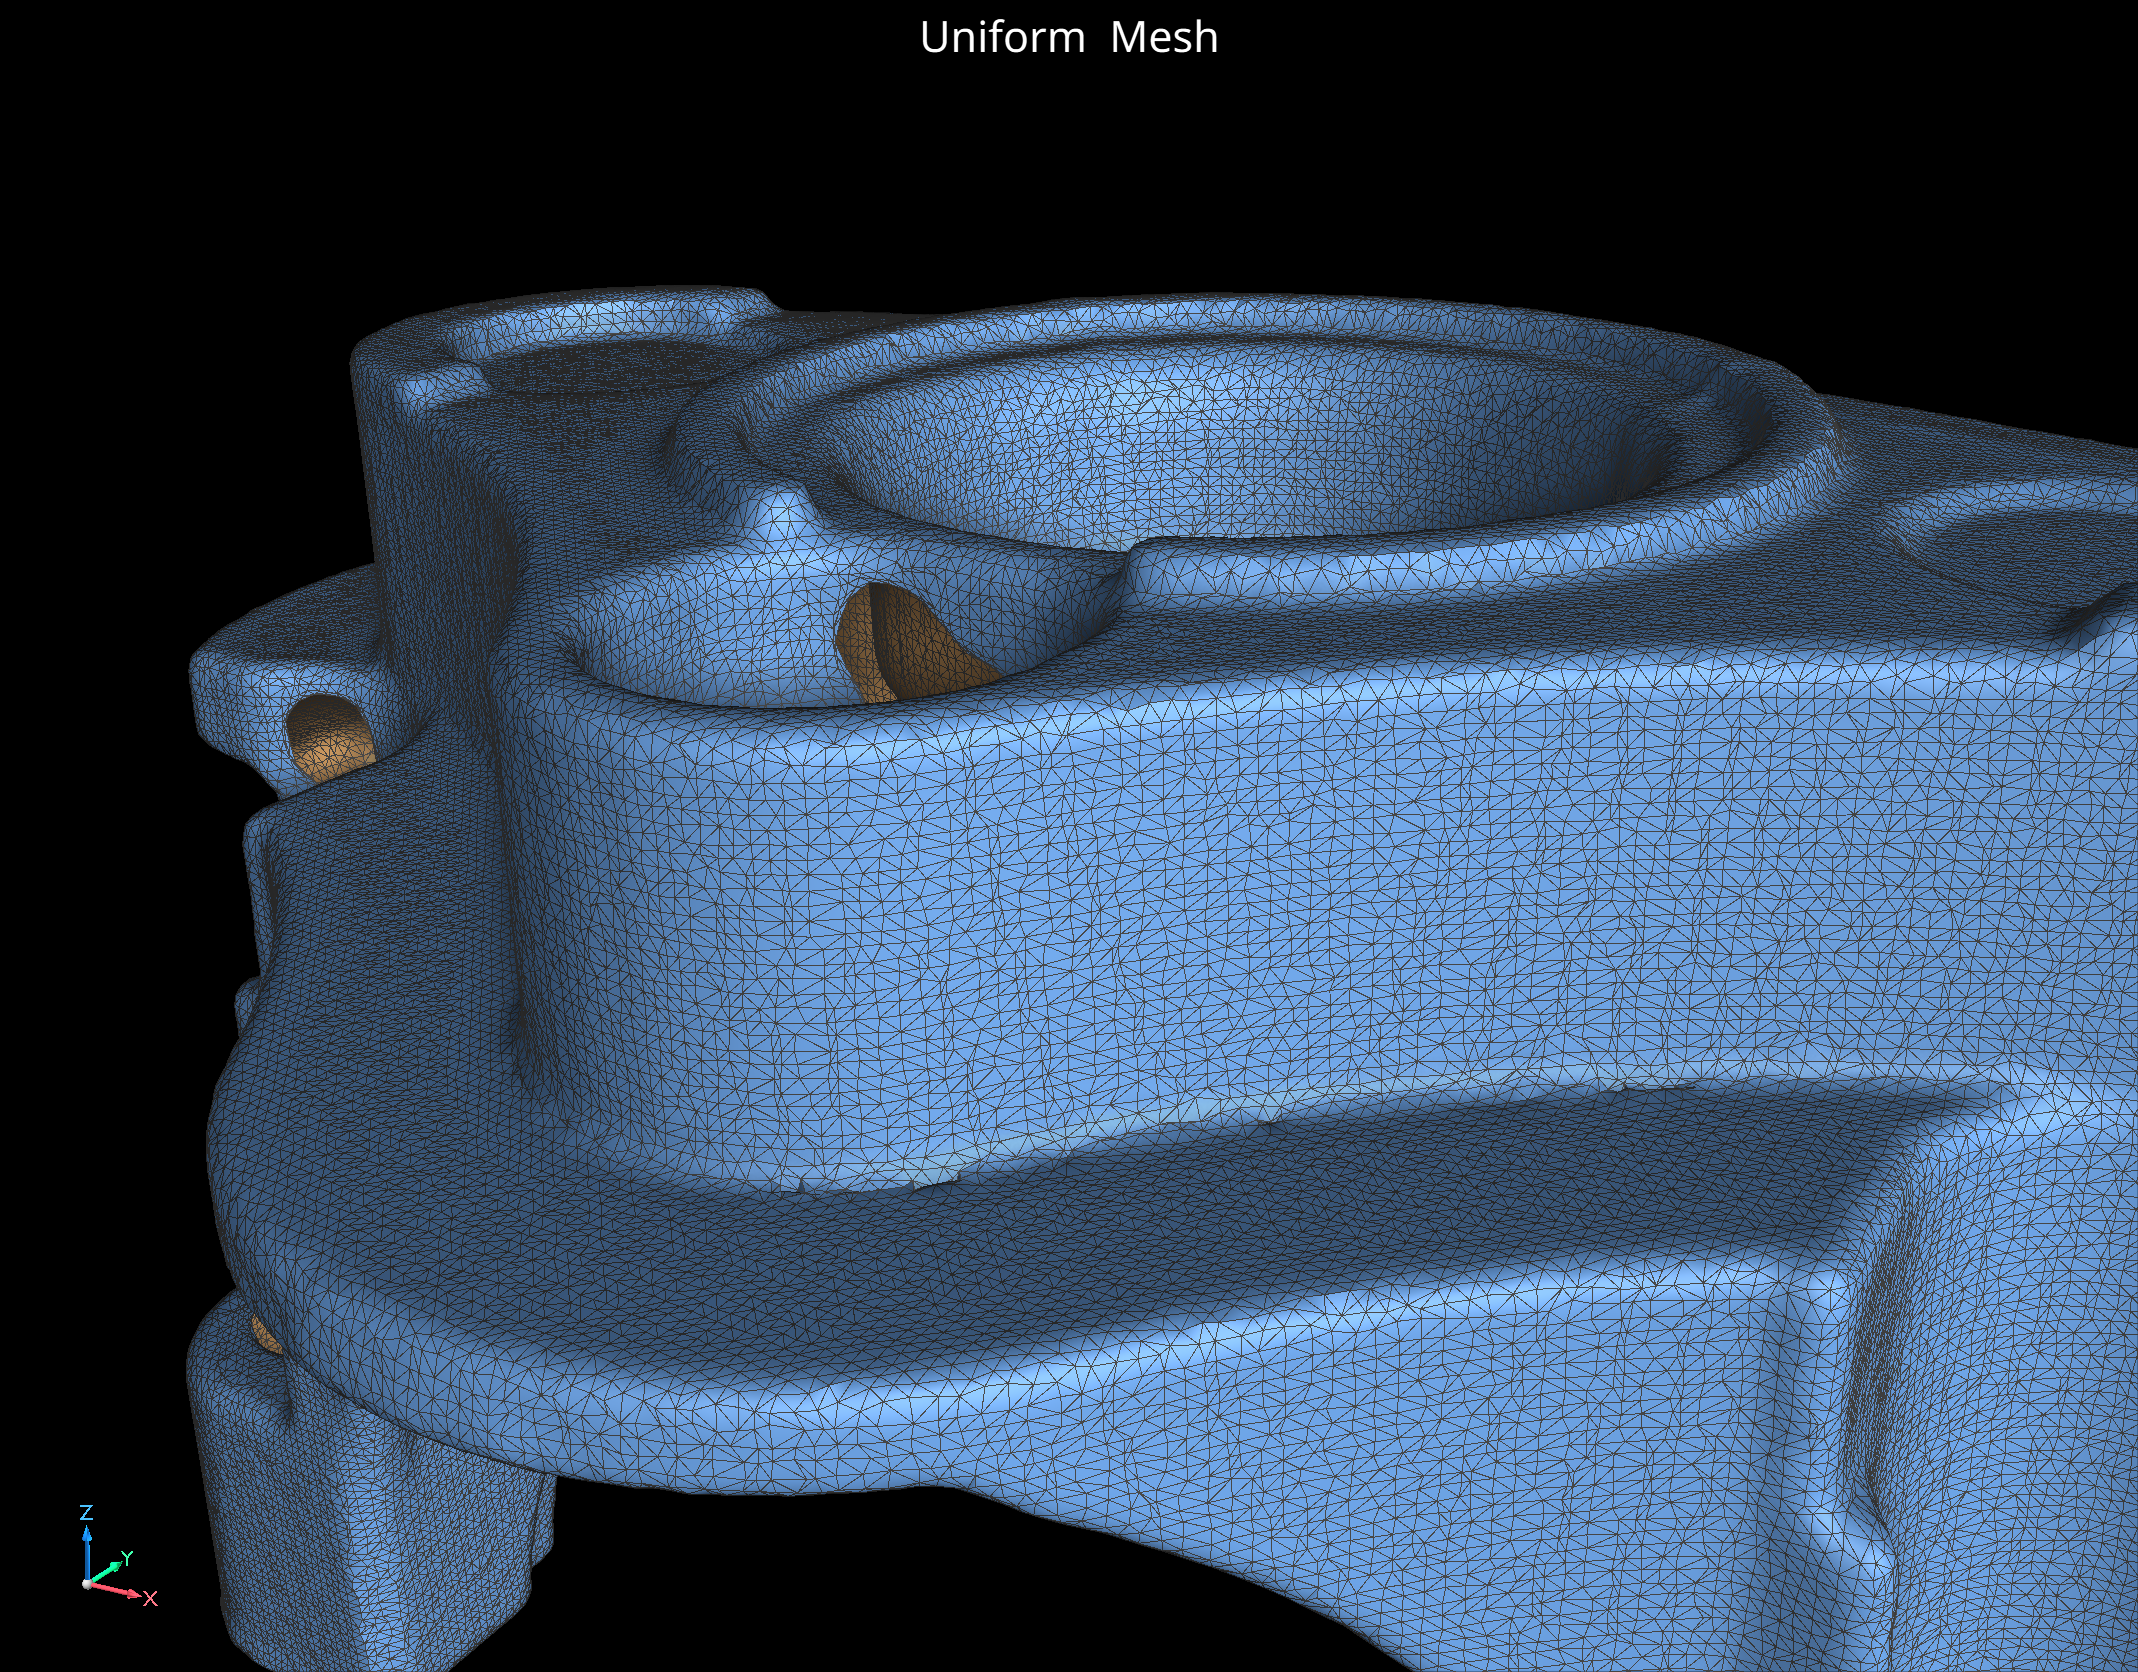
A new uniform meshing algorithm enables fast point cloud import by generating nearly uniform triangles and automatically smoothing the data.
Point cloud data in ASTM E57 format can now be imported directly into VGSTUDIO MAX and VGMETROLOGY.
Stay compliant with the latest standard using the new “Contacting (ISO 5459:2024)” planar datum fit method.
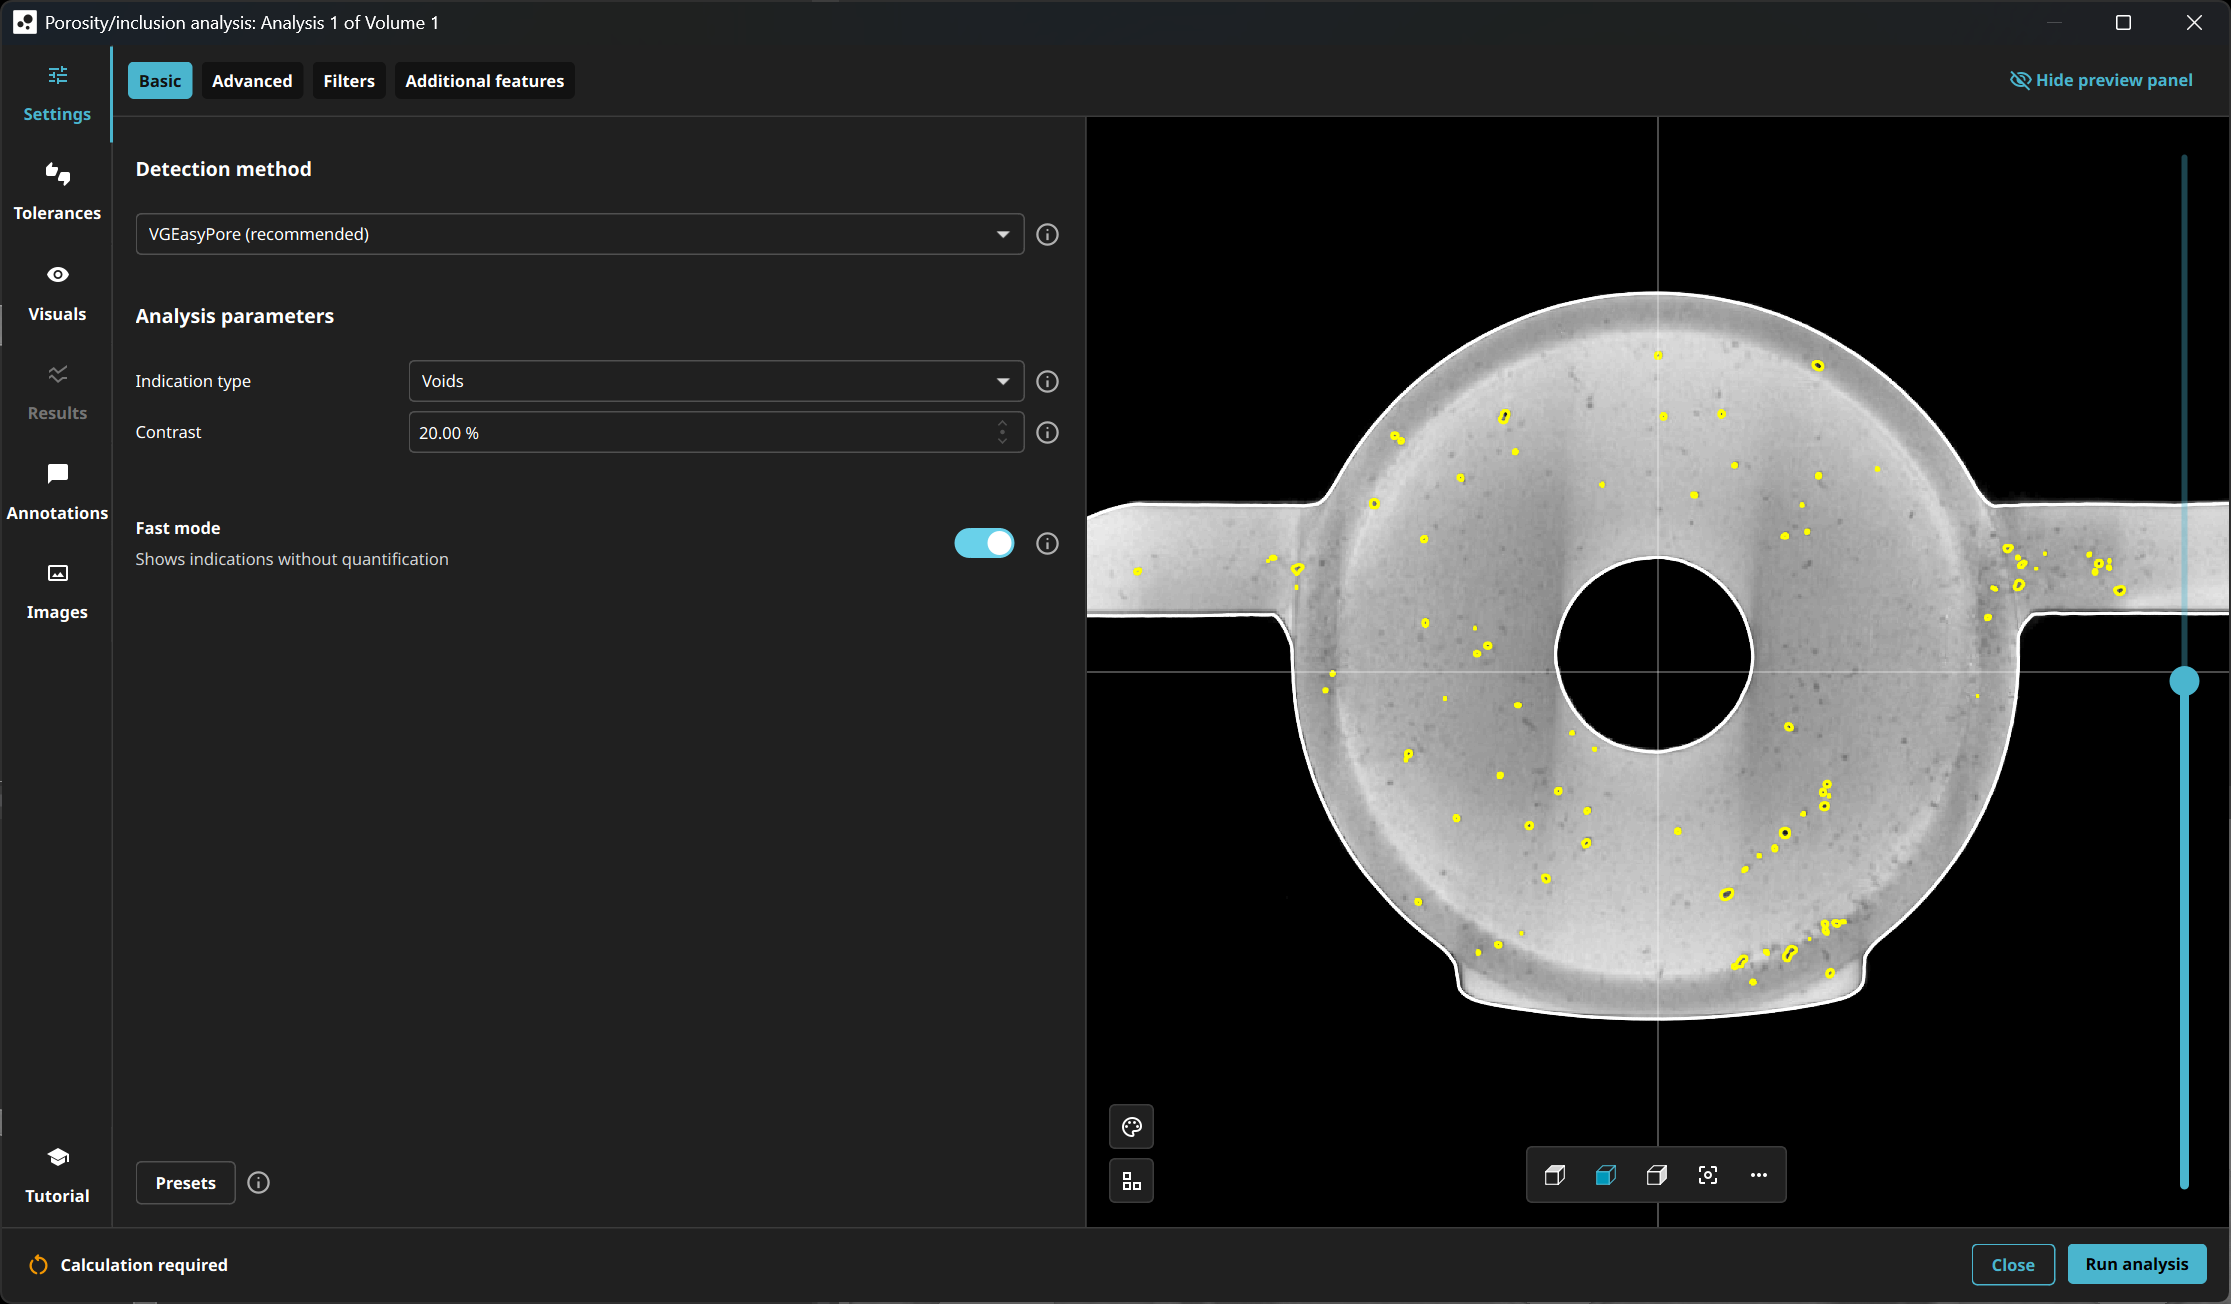
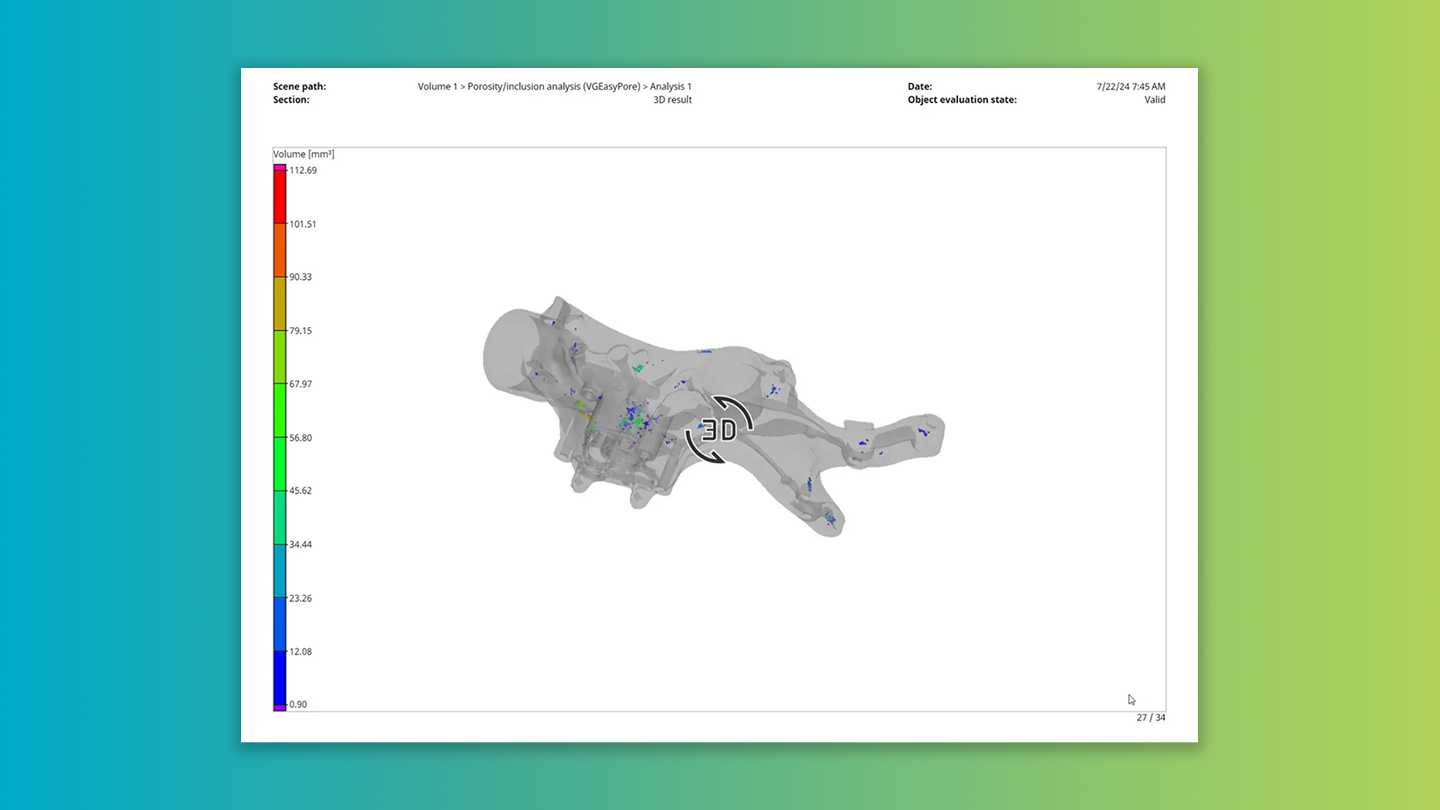
If you prefer speed over quantitative evaluation, you can now do a porosity/inclusion analysis without quantification using the “Fast mode.” This speeds up your analysis significantly, especially for large numbers of pores.
The fast mode provides voxel counts, which directly correlate with pore volume, allowing you to quickly identify the largest pore in your part.
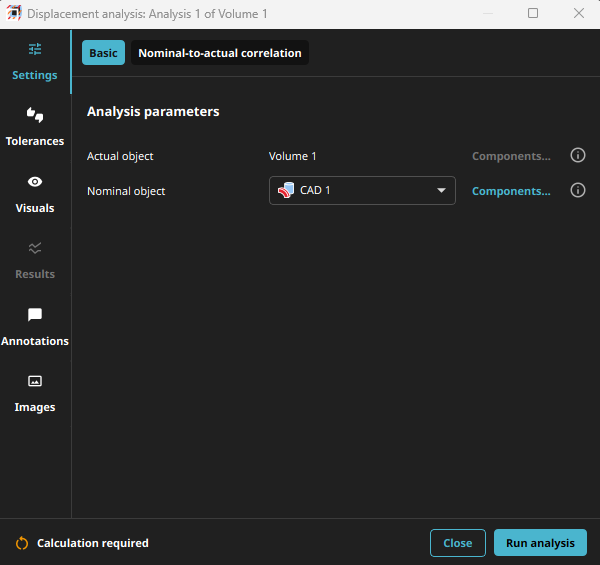
Discover a smarter, more intuitive way to perform displacement analysis.
The user interface has been completely redesigned to deliver clarity and efficiency at every step. All essential settings are now consolidated into a single, streamlined view — giving you instant control and full transparency.
Enhanced features and an optimized layout ensure a smooth experience for everyone, from seasoned experts to first-time users. Perform precise, reliable analyses of components and material samples with confidence — faster, simpler, and more accessible than ever before.
It is now possible to add metainformation to measurement templates, such as revision ID or author, to use this information in reports.
You now can hide rows of tolerance tables — for example, of a porosity/inclusion analysis — that are not toleranced or calculated, keeping reports clean and focused.
Deep segmentation can now be run on multiple GPUs in parallel, allowing you to improve performance by adding more hardware.

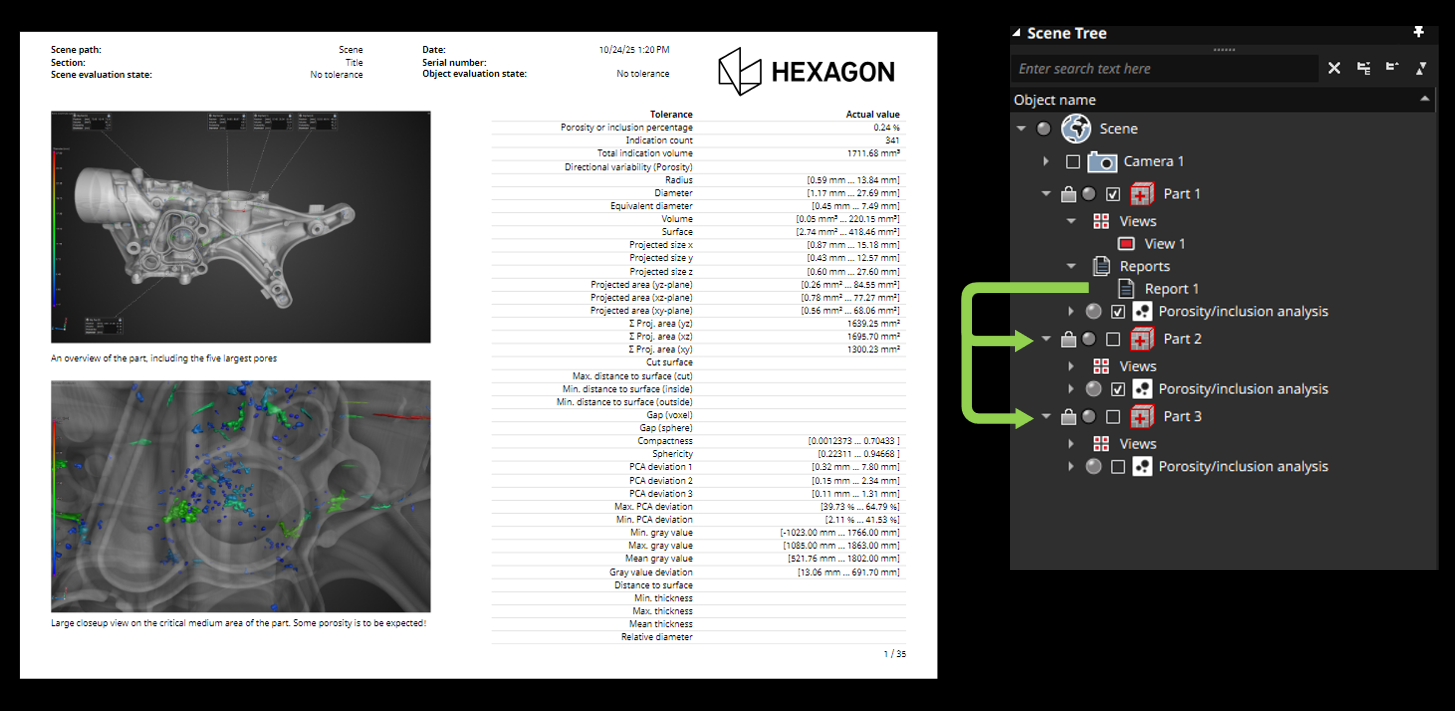
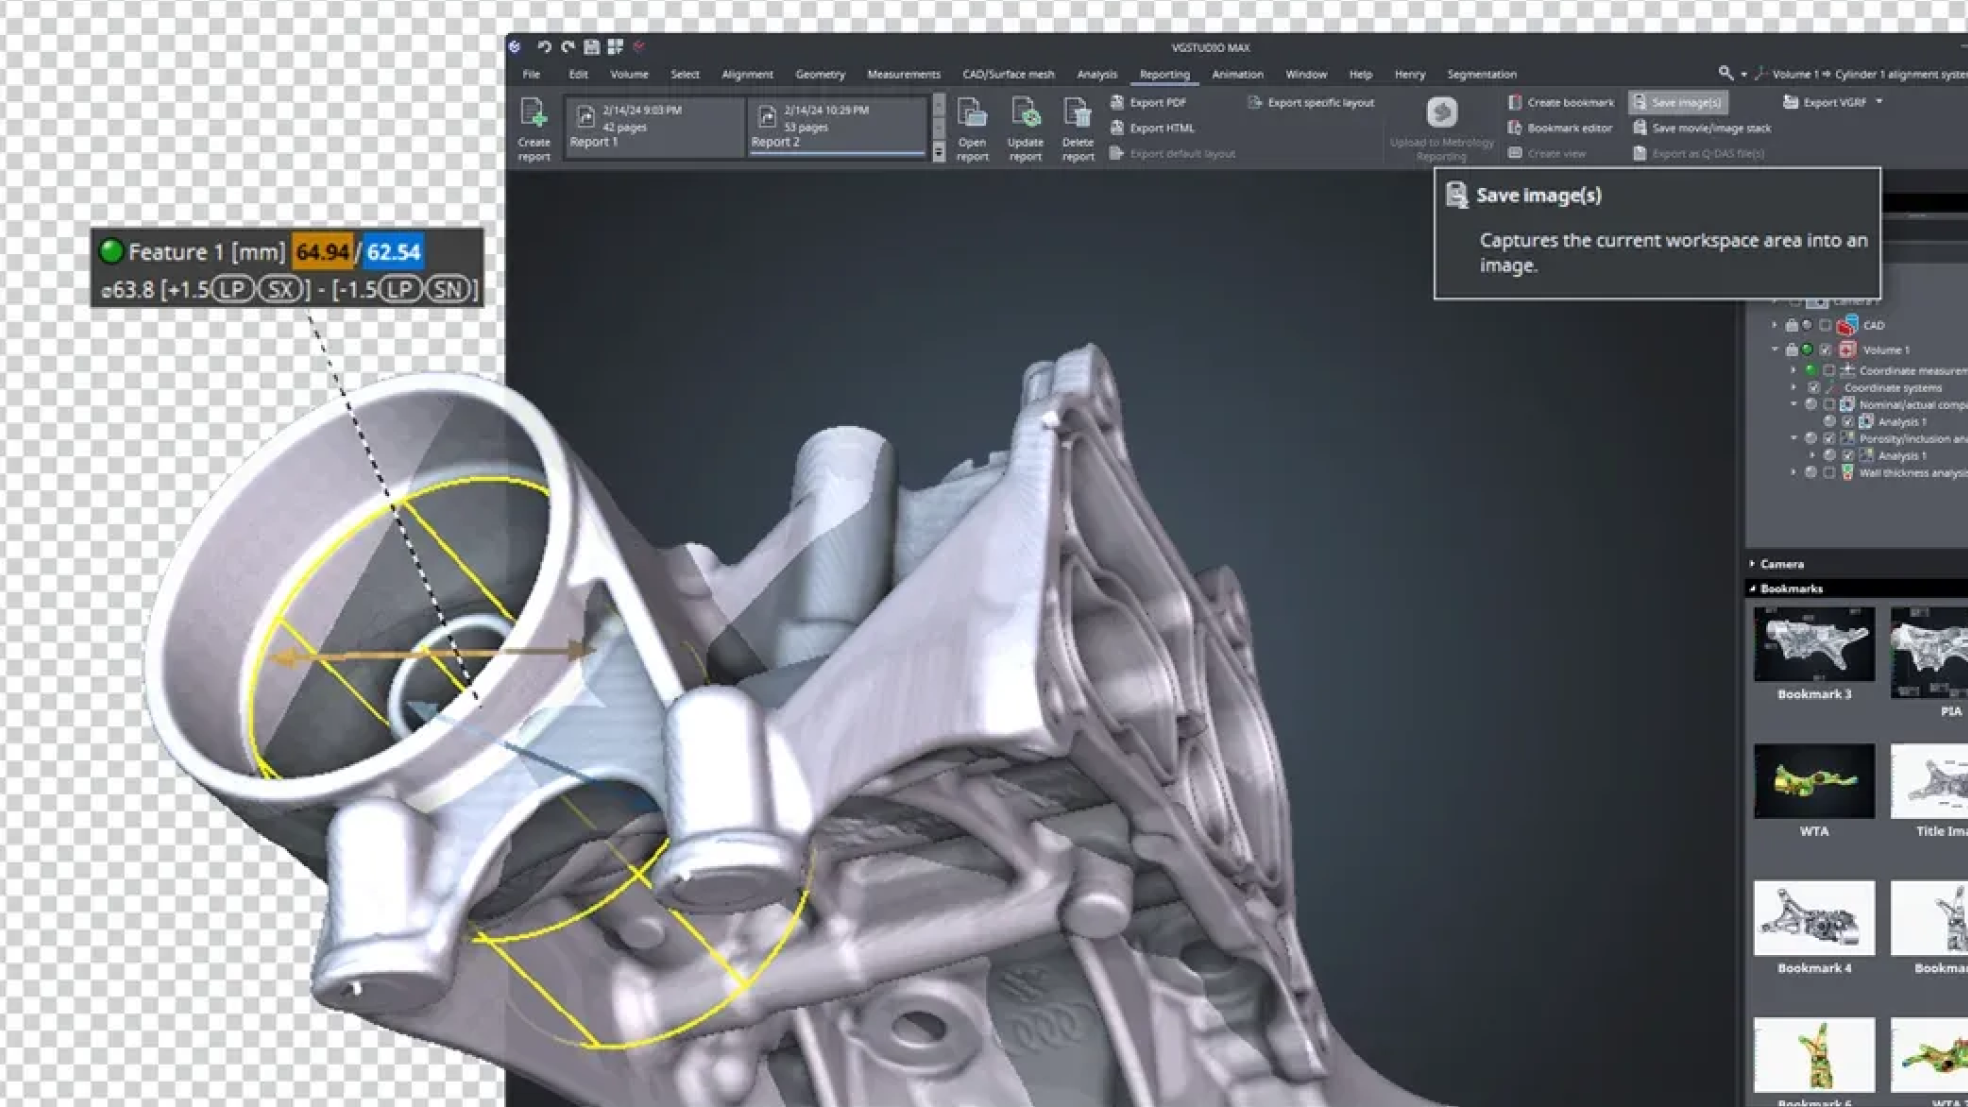
You can now define not only a report for an entire project (project report), as before, but also a report for an individual part (part report). A part report can be quickly and easily copied to similar parts that are analyzed in the same way. Alternatively, you can import an evaluation template, which now also includes the new part report. Both approaches help ensure consistent documentation across repeated inspections.
You can easily distinguish between the two report types in the Scene Tree: a project report appears beneath the “Scene” entry, whereas a part report is listed under the corresponding object.
You can now also create views at scene level to store the visualization and workspace settings of the entire project, which completely eliminates the need for bookmarks. Scene views are included in evaluation templates, which makes it very easy to automatically create images at scene level.
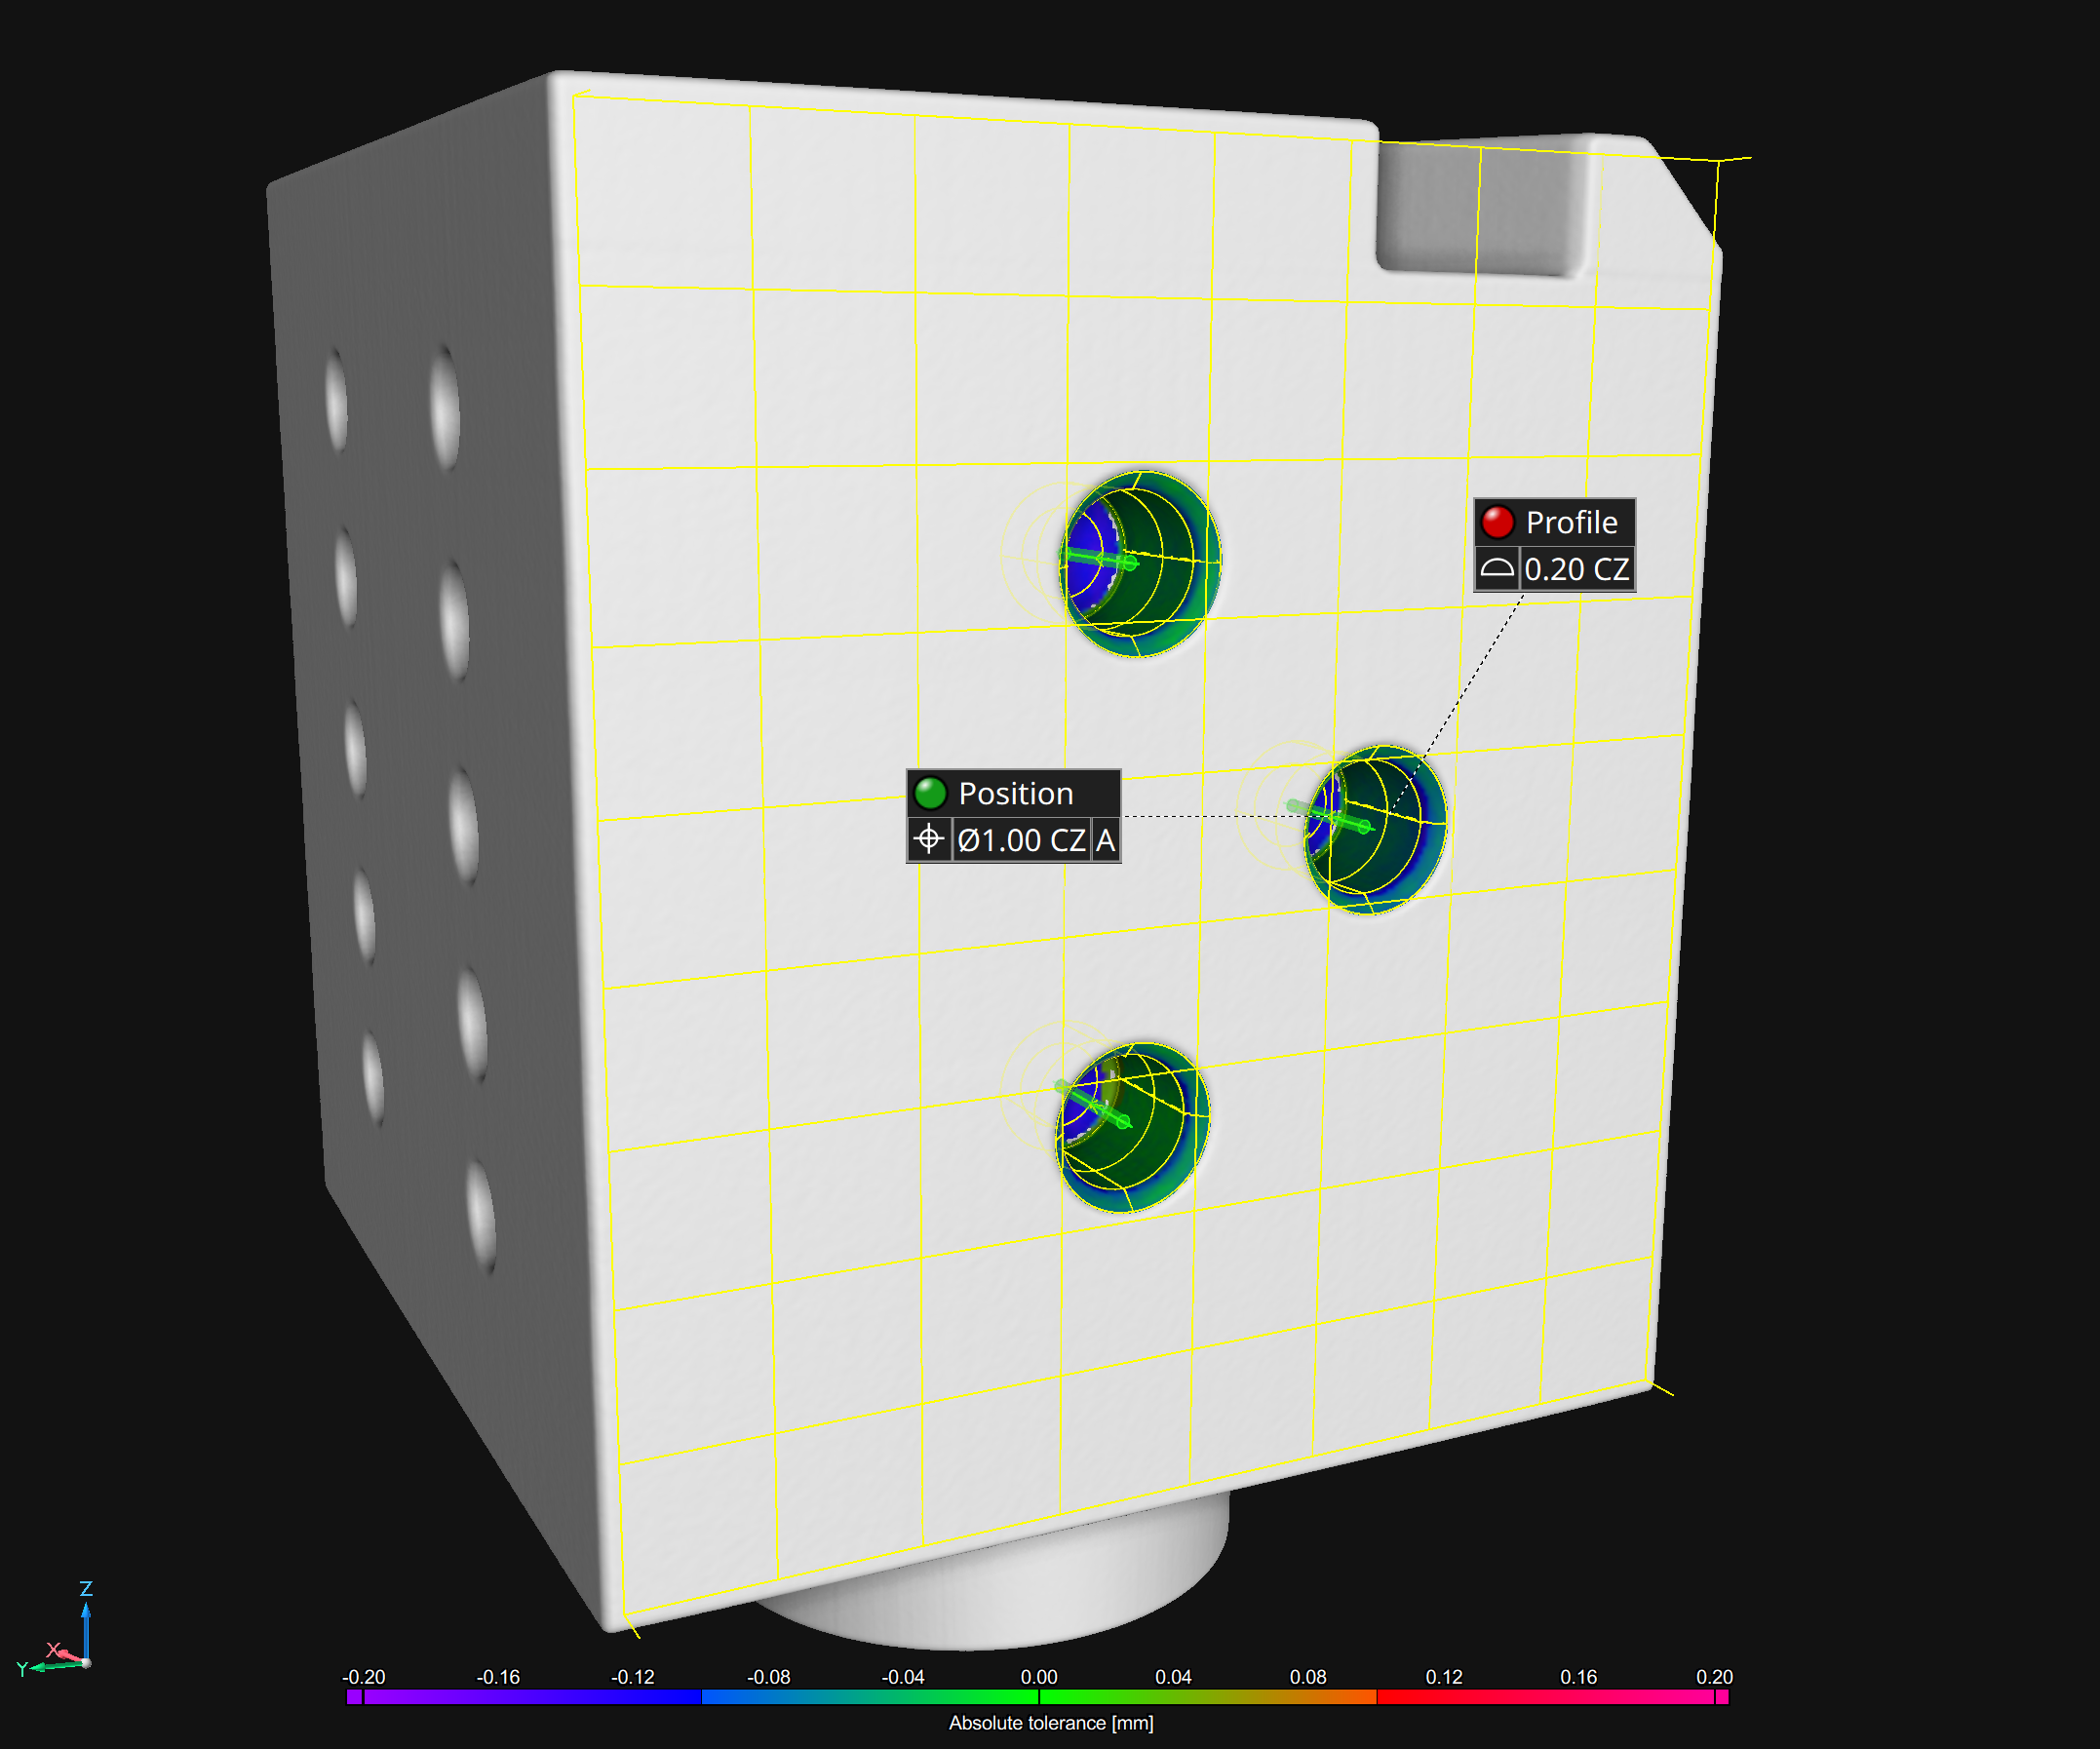
A position or profile tolerance for a geometry element in a pattern can now be specified with the SZ or CZ modifier: you can either create a separate tolerance zone (SZ) for the individual element or a combined zone (CZ) for all corresponding elements in the pattern. This allows you to conveniently measure, for example, the position of a bore hole pattern.
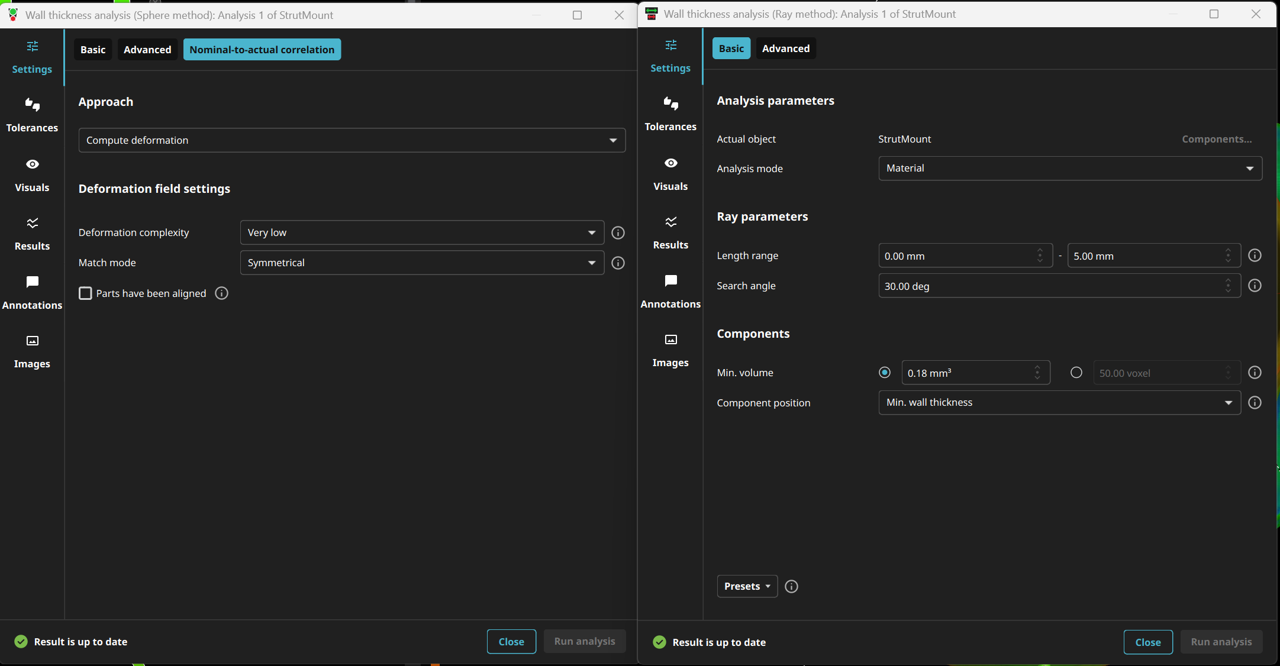
With version 2025.4 of the Hexagon VG software product line, the user interface for wall thickness analyses has been completely redesigned. For both the Ray and Sphere methods, all essential settings are now conveniently summarized at a glance, while advanced options are easily accessible on separate tabs.
What's new?
- Intuitive design: Key settings are immediately visible, and advanced options are clearly organized on separate tabs.
- Efficient workflow: Enjoy fewer clicks, greater overview, and maximum control.
- Consistent dialogs: The wording and layout of both dialogs have been standardized, ensuring a smooth transition between methods.
The new features and optimized layout make the software accessible to both experienced users and beginners, enabling precise and efficient analyses of components or material samples.
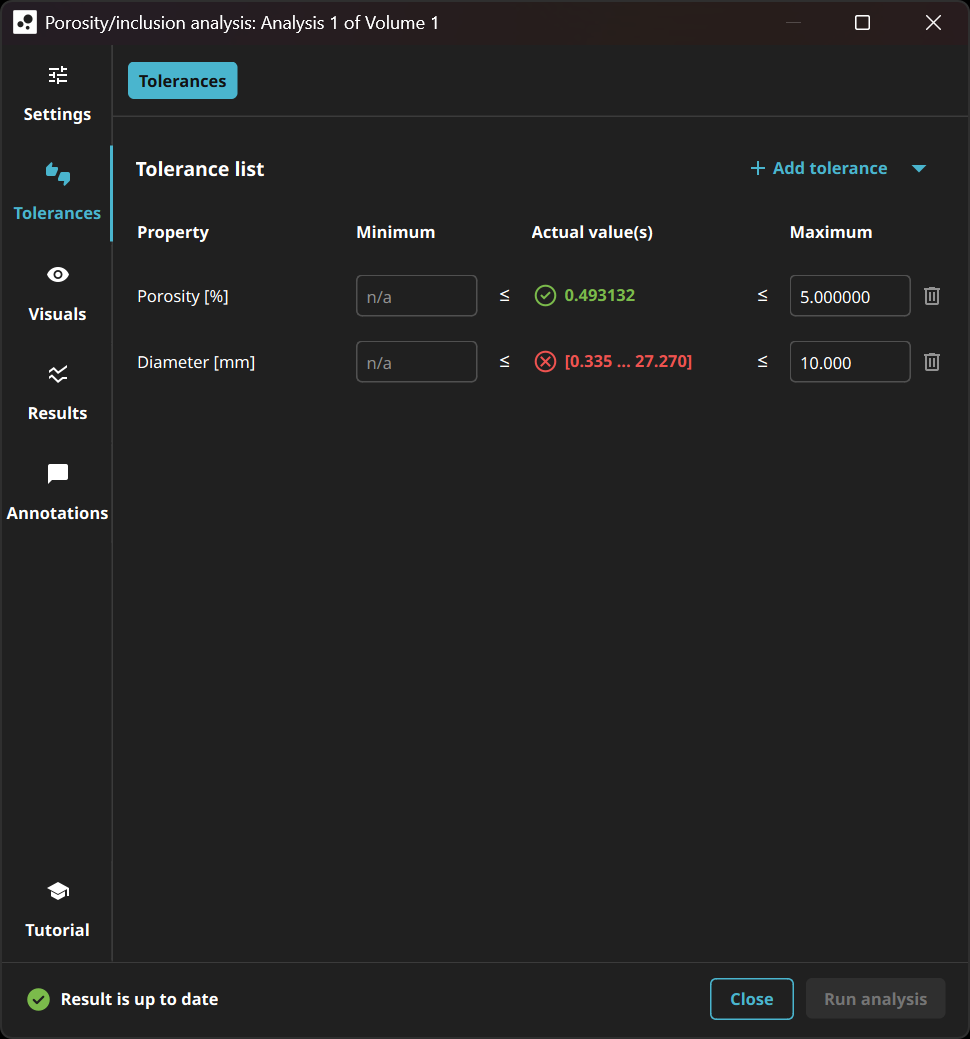
The new tolerancing page is simpler and more focused, displaying only the properties you want to tolerate. It now allows you to define precise limits for each pore property in both directions (upper and lower), offering greater flexibility to meet specific requirements.
By allowing users to add custom text descriptions to their views within projects and reports, this feature enhances customization and provides more detailed information, making it easier to navigate projects and create more informative reports.
The removal of the automatic image checkboxes encourages our customers to use the more powerful and flexible views, which simplifies the image creation process. To ease the transition, existing projects will automatically convert to this new system, though occasionally users might need to adjust views manually to match previous images exactly.
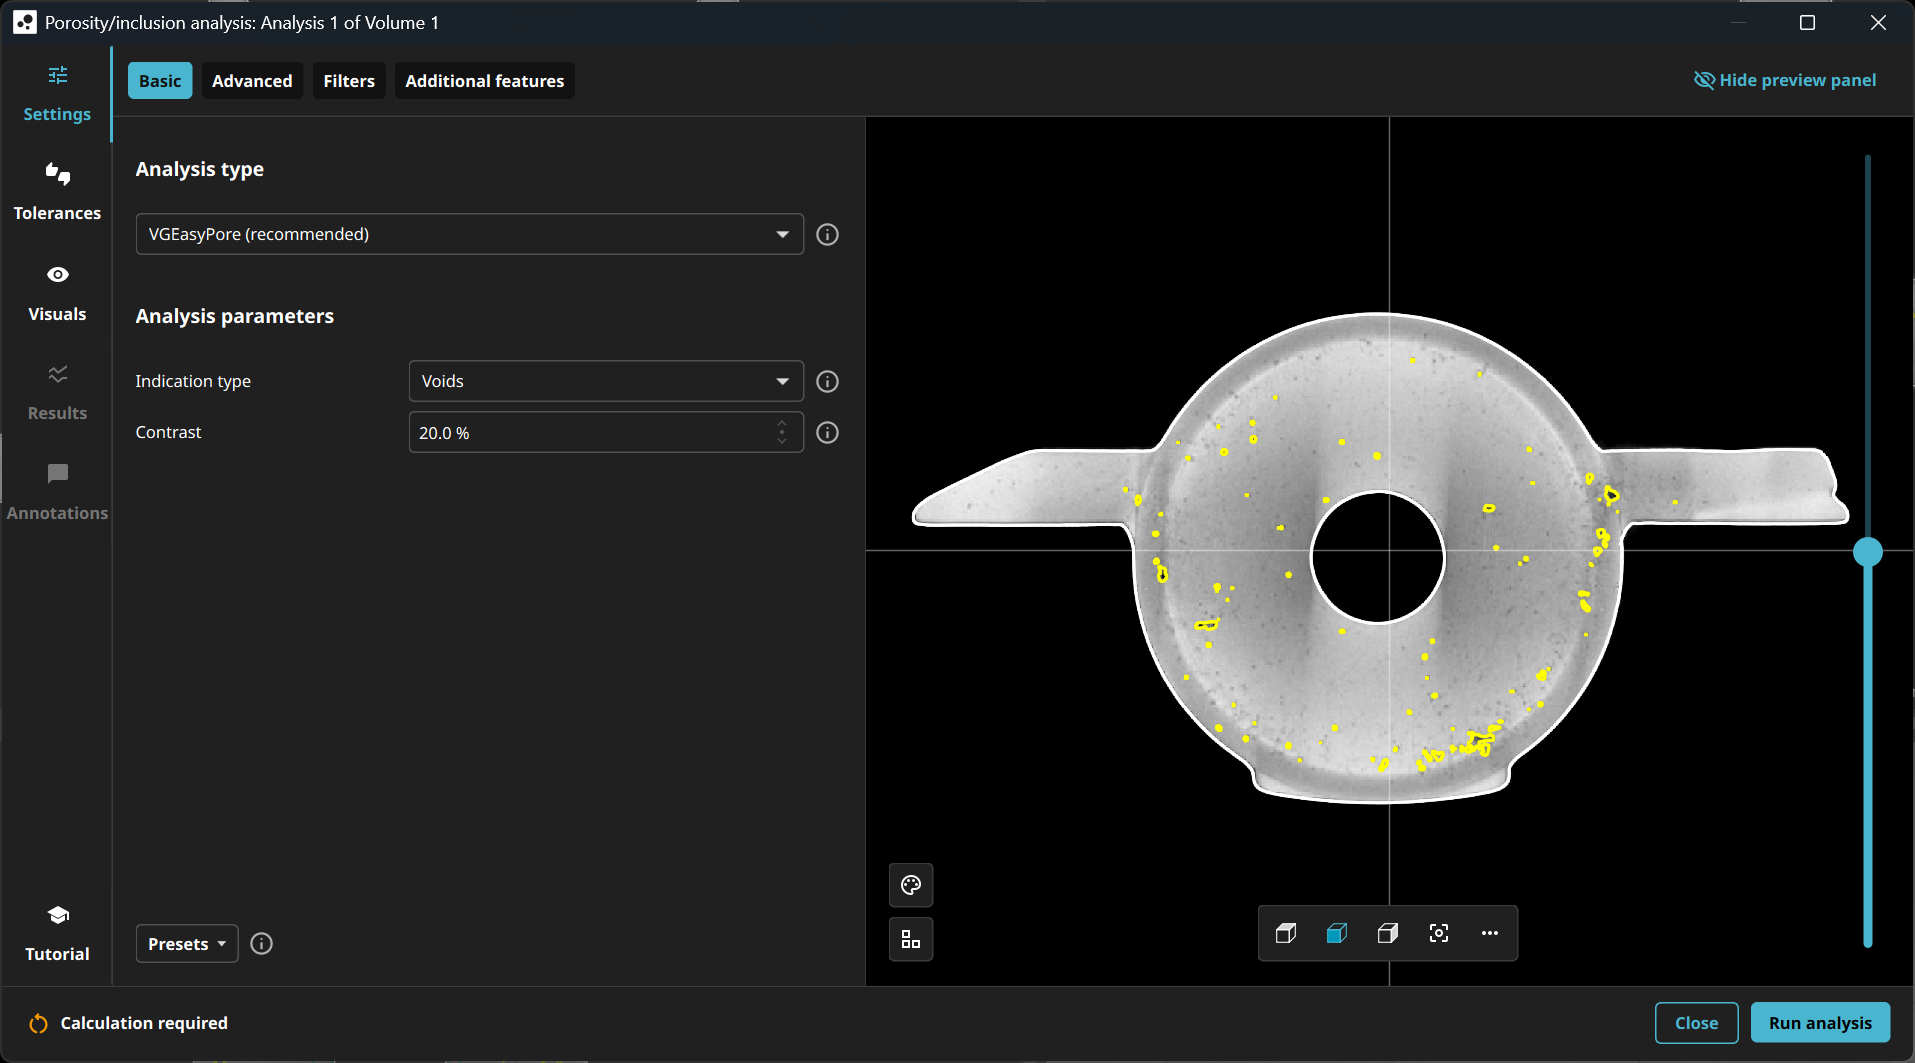
With VGSTUDIO MAX 2025.3, the user interface for porosity/inclusion analysis has been completely redesigned. For you, this means that all important settings are now summarized at a glance, while advanced options are easily accessible on separate tabs.
The preview has been seamlessly integrated into the analysis window and also includes an interactive minimap that shows your current position in the analysis window. This makes navigation easier and ensures that you always have an overview of your component.
What's new?
- Intuitive design: All important settings are immediately visible, while advanced options are clearly organized on separate tabs.
- Efficient workflow: Fewer clicks, more overview, maximum control. For the first time, all porosity/inclusion analysis procedures have been brought together in a single solution. This allows for direct access to the core functions and eliminates the need to switch between different dialogs, saving valuable time.
- Everything at a glance: The new preview in the analysis dialog combines all important information and makes navigation easier thanks to the interactive minimap.
The new functions and optimized layout make the software accessible to both experienced users and beginners and enable precise and efficient analysis of components or material samples.
With 2025.3, we are introducing a completely new porosity/inclusion analysis that for the first time combines all previous methods in a single, powerful solution — from analysis to reporting.
The new porosity/inclusion analysis will revolutionize the way you work and help you make decisions faster and more efficiently. Version 2025.3 defines the future of porosity/inclusion analysis — simple, flexible, and powerful.

This feature enables users to incorporate mesh-related metainformation in inspection reports, just as it is already possible for volume metainformation. This enhancement makes reports more customizable and improves traceability, providing greater clarity and more comprehensive documentation.
This enhancement improves the export of volume data in DICONDE format by including extra fields such as "Company address" and "Component notes." This allows users to add more detailed and standardized information about parts, improving data organization and communication.
The enhanced mesh import and export feature now supports GLB/GLTF, AMF, and 3MF file formats, making it easier to exchange 3D surface data with other applications. This allows you, for example, to directly import and use mesh data created for additive manufacturing and stored in AMF or 3MF formats as nominal reference data without the need to convert it to an intermediate format or export colored meshes created from analysis results or extracted from volume objects in GLB format, which can be easily exchanged with other applications such as PowerPoint.

Designed to enhance the accuracy of optical character recognition, this new function addresses misidentification of characters due to data quality or font variations, in which, for example, a "1" might be mistaken for an "I" or a "5" for an "S." By leveraging character substitutions and applying constraints based on the expected text format (e.g., numeric-only entries in specific positions), this feature can automatically correct these misidentifications to a significant extent. This improvement enhances the reliability of text recognition in your analysis.
As we continue to enhance the VG software experience, we will retire legacy reporting with the 2025.3 release this fall. The integrated reporting editor introduced with version 3.4.4 and continuously enhanced since then offers a full-featured solution for creating and adapting report documents, surpassing the capabilities of the legacy reporting.
Starting with version 2025.3, you will no longer be able to create legacy reports. The macros designed for these reports will cease to function in subsequent versions.
We encourage you to transition to the integrated reporting editor to take advantage of its robust features and improved functionality.
We value your feedback and are here to assist with any concerns regarding this change. Please reach out to us if you have any questions or require support during this transition. Together, let's embrace a more efficient and powerful reporting experience with VG software.
This significant enhancement is tailored for complex cases involving high morphing complexity and partial scans.
Microsoft will be ending support for Windows 10 in October 2025. In alignment with this change, we will also conclude official support for VG applications running on Windows 10 starting with version 2025.3.
We encourage affected users to upgrade their operating system to continue benefiting from the full capabilities of VGSTUDIO, VGSTUDIO MAX, VGMETROLOGY, VGinLINE, and other VG software products.
This is an important step towards ensuring our VG software suite operates optimally on modern platforms, providing you with enhanced performance, security, and compatibility.
For assistance with upgrading or any questions, please contact our support team.
Define and apply visualization and workspace settings as "Views" for individual objects, enhancing project navigation and report generation. Easily transfer these views between objects and incorporate them into evaluation templates for streamlined automation.
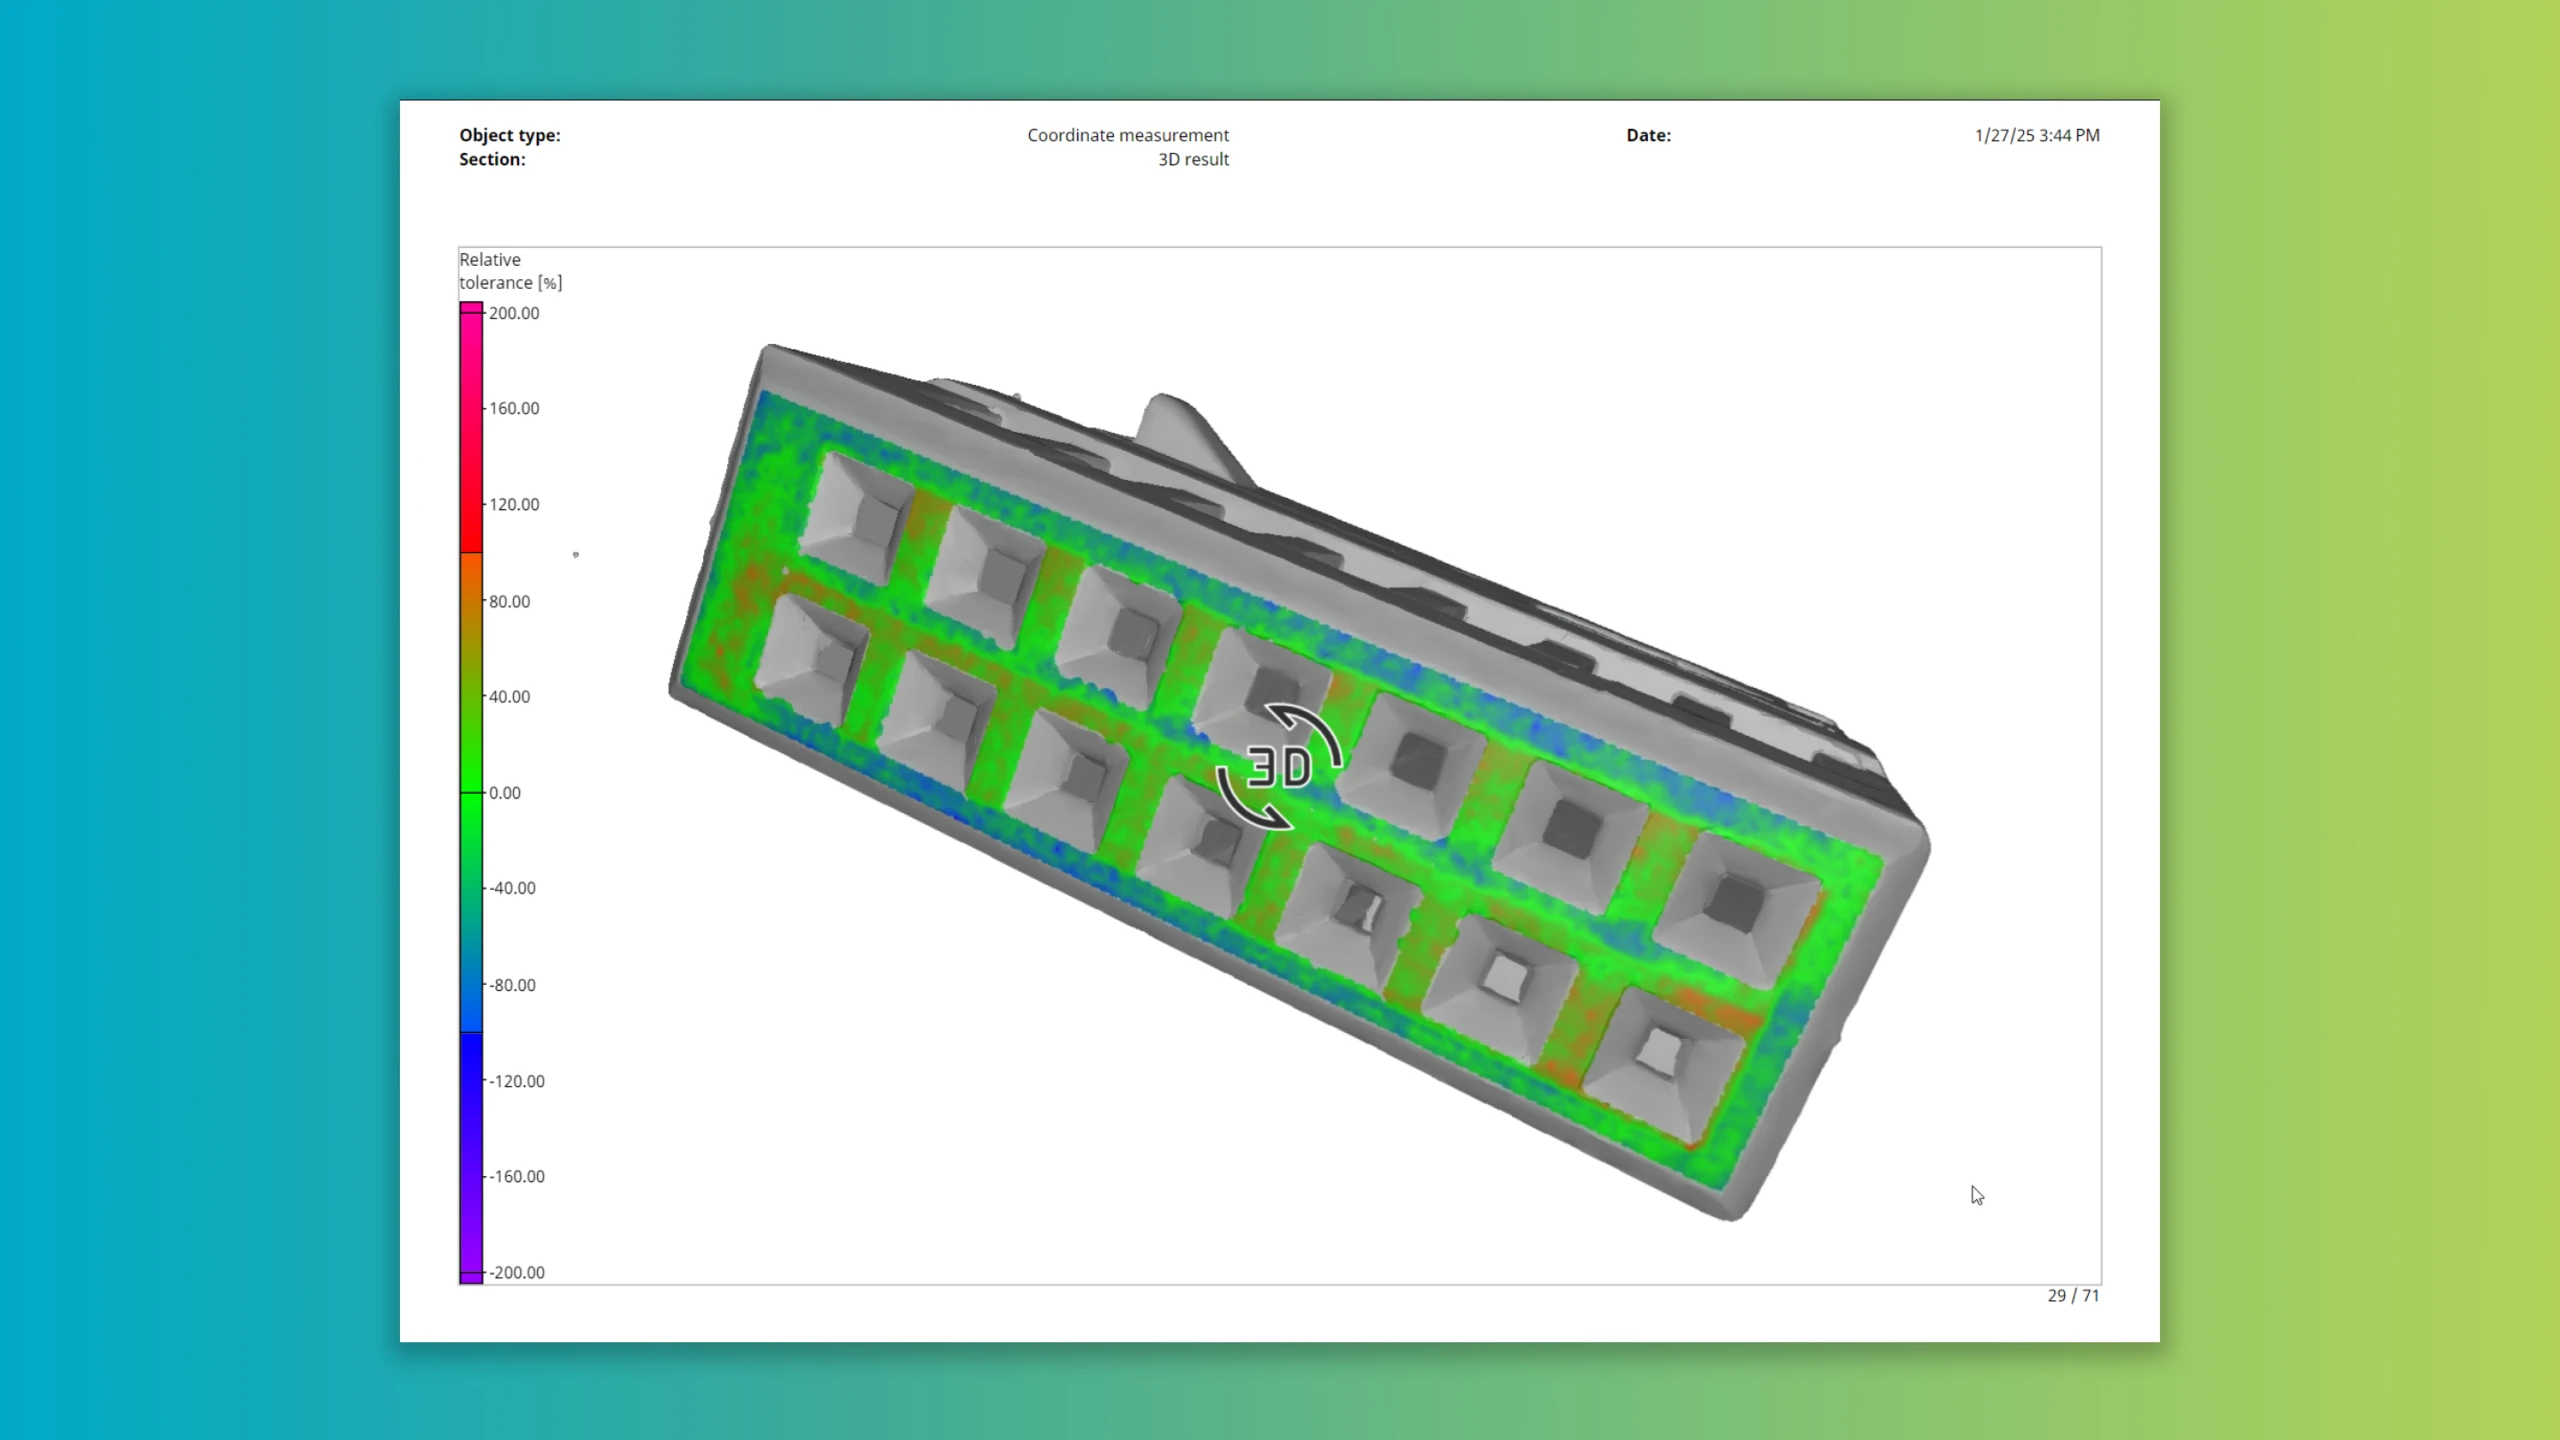
Enhance your reports with interactive 3D color overlays for geometric tolerances, facilitating a better understanding of numerical results.
Streamline data processing with the new .xvgi file format, eliminating the need for manual data import. Utilize our Python reference implementation to automate VG software use, even without existing .vgl files.
Focus on actual deviations with auto-scaled color mapping that excludes outliers. This ensures color overlays provide valuable part evaluations without distortion.
The selected color overlay and "Show components only" checkbox are now stored and applied to all automated image generation functions including bookmarks, animations, and object-specific views. This enhances your options for reports and presentations.
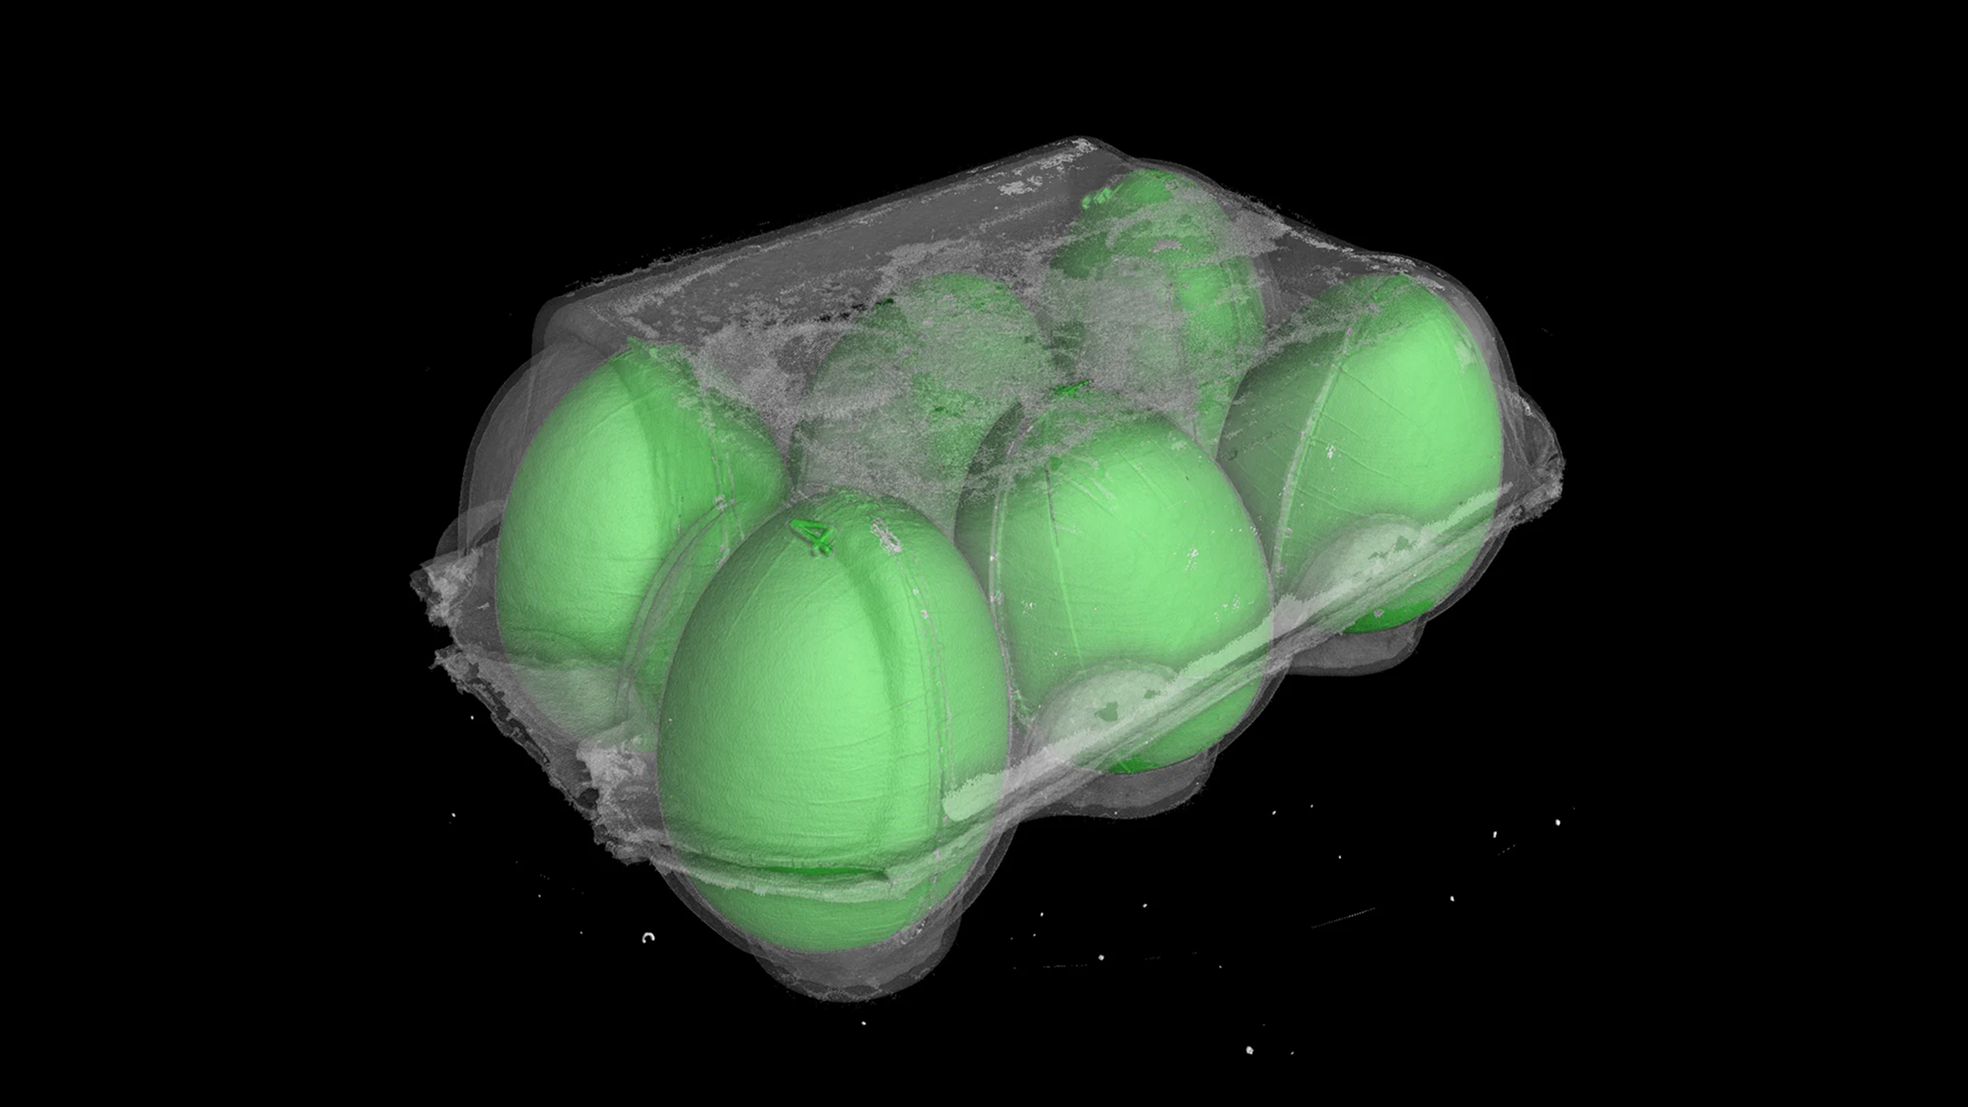
Designed especially for cases where multiple parts are scanned together, this intuitive feature allows users to easily divide the original volume data into individual volume objects. Beyond simplifying your workflow, this tool offers options for powerful segmentation, naming, and data reduction methods. Plus, automation has never been easier, with built-in features to detect missing parts and generate unique project files for each separated object.
Q-DAS export for relative wall thickness results
Elevate your data analytics with seamless exporting of toleranced relative wall thickness results in Q-DAS format. Enjoy superior compatibility and integration with the Q-DAS product family.
Easier navigation of PDF reports
PDF reports now also include a table of contents with direct links to the related section of the report. Enhance your user experience and swiftly peruse your reports with this clever addition.
When you move or rotate a region of interest (ROI) or copy it from another object, its mask may not be aligned with the voxel grid of the parent volume. This useful feature allows you to see this status at a glance in the Scene Tree or in the object properties. One click is enough to get the ROI aligned, an action that can also be recorded for automated scenarios.
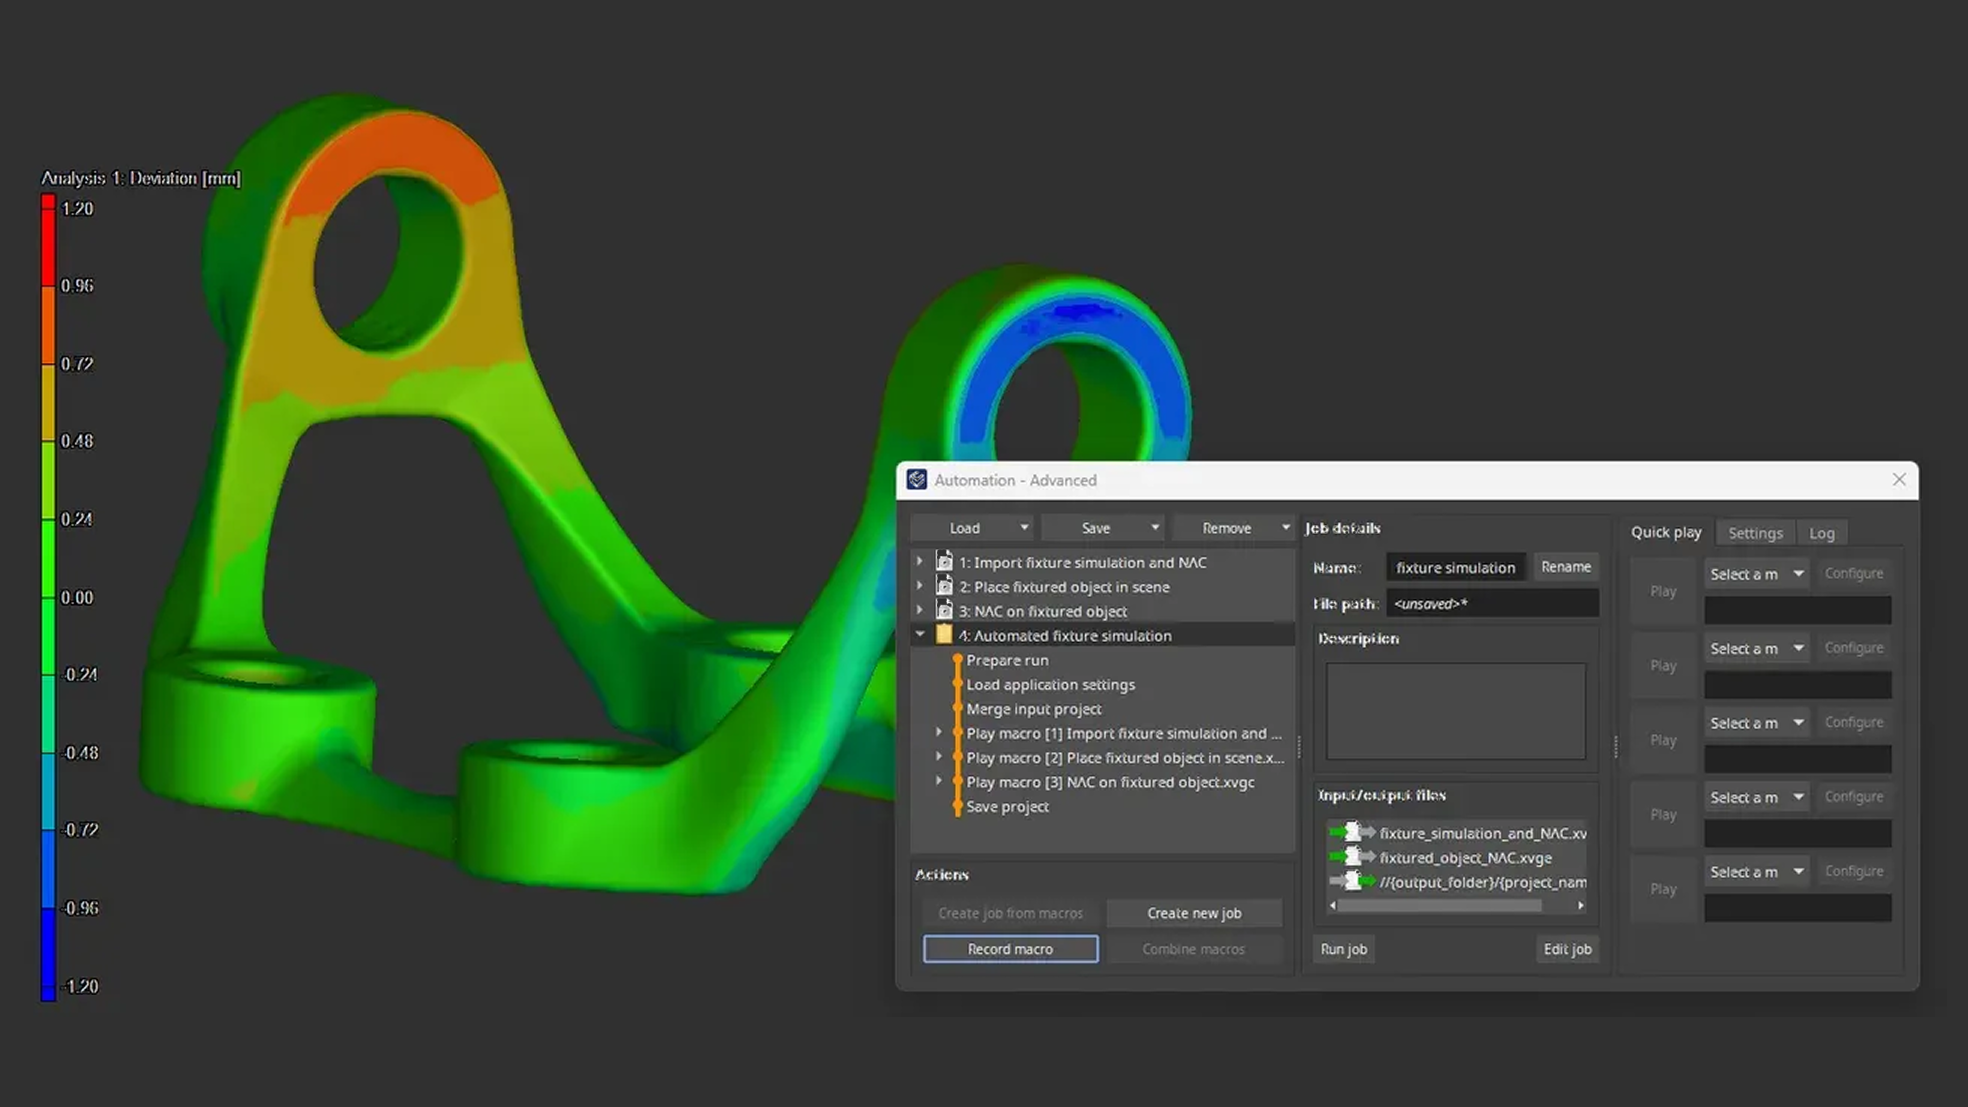
In this video, we will show you how to perform the analyses required for fixture simulation, record the necessary macros, and combine the macros to a job that you can eventually run in VGinLINE.
Click here to watch the video tutorial.
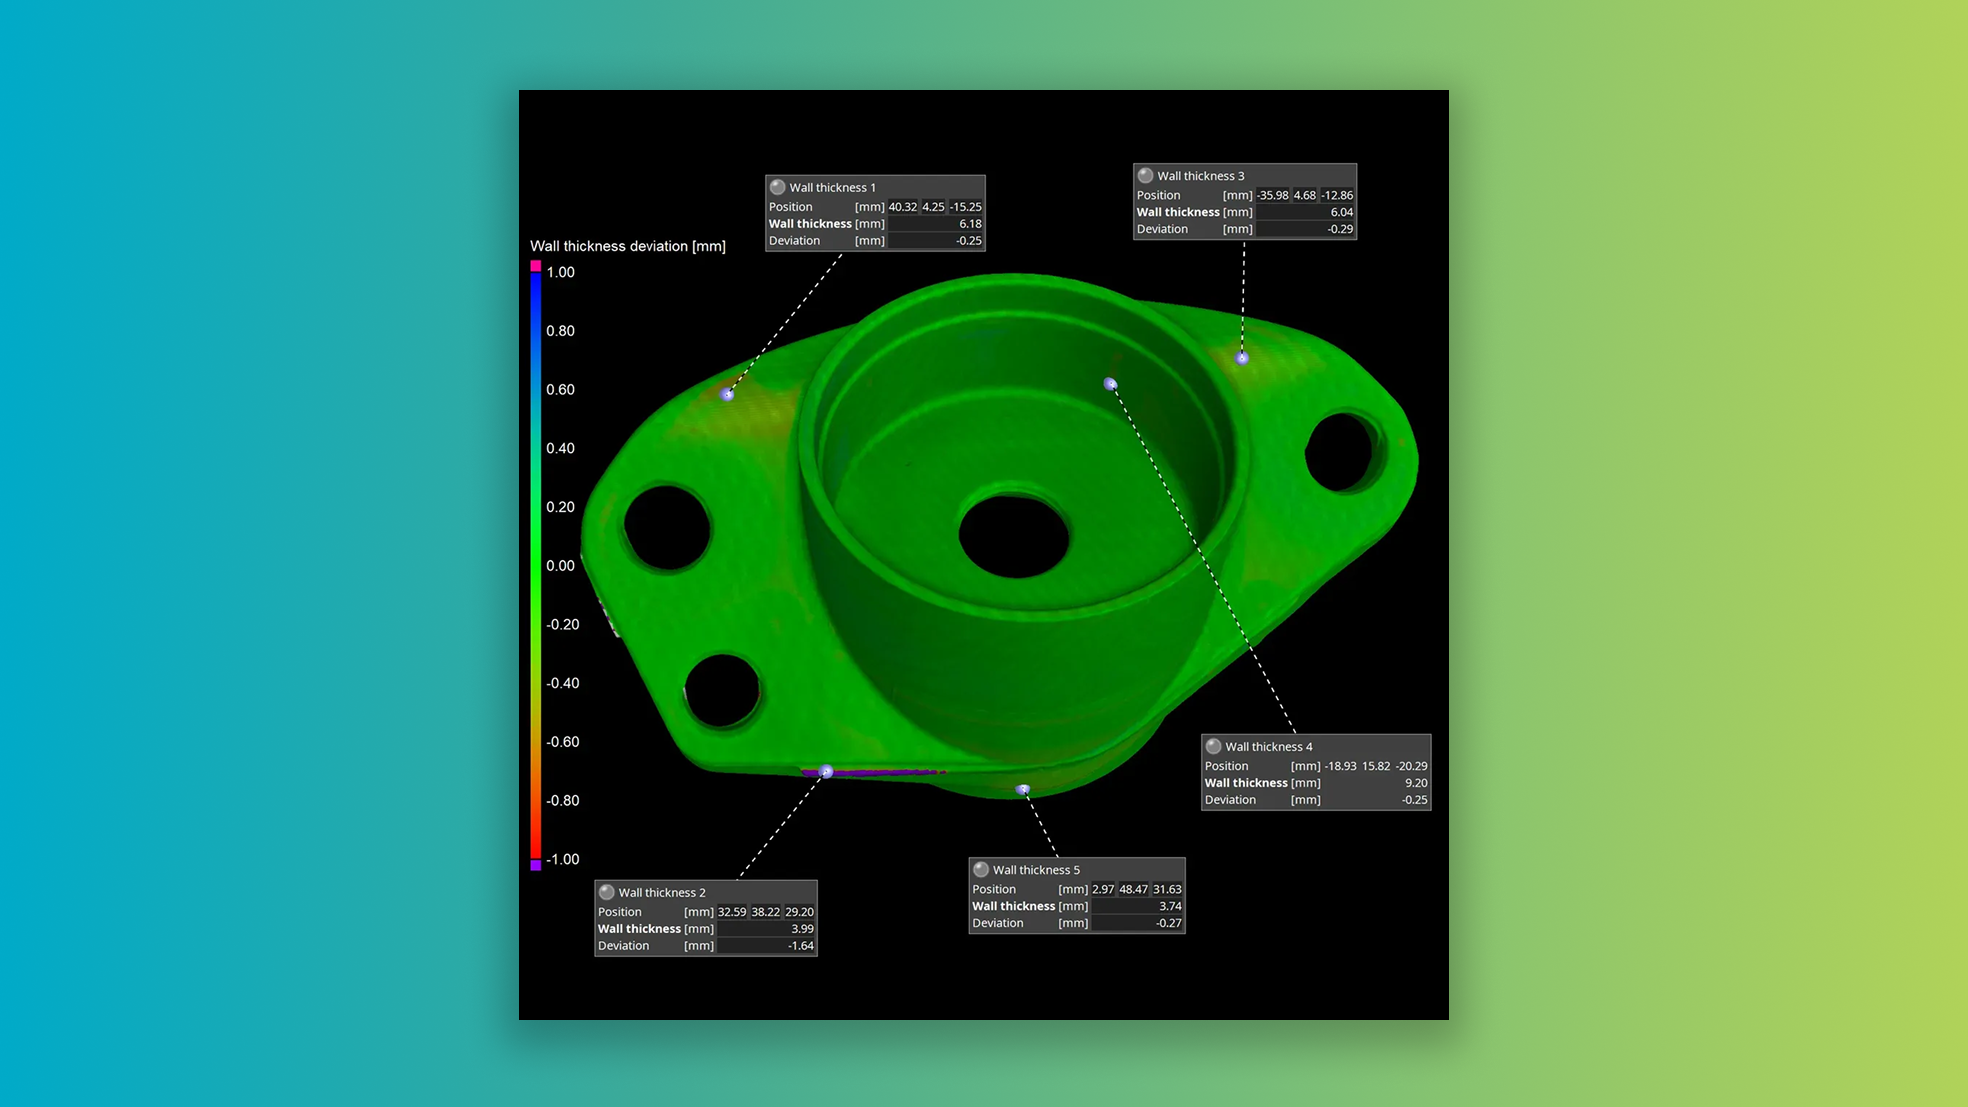
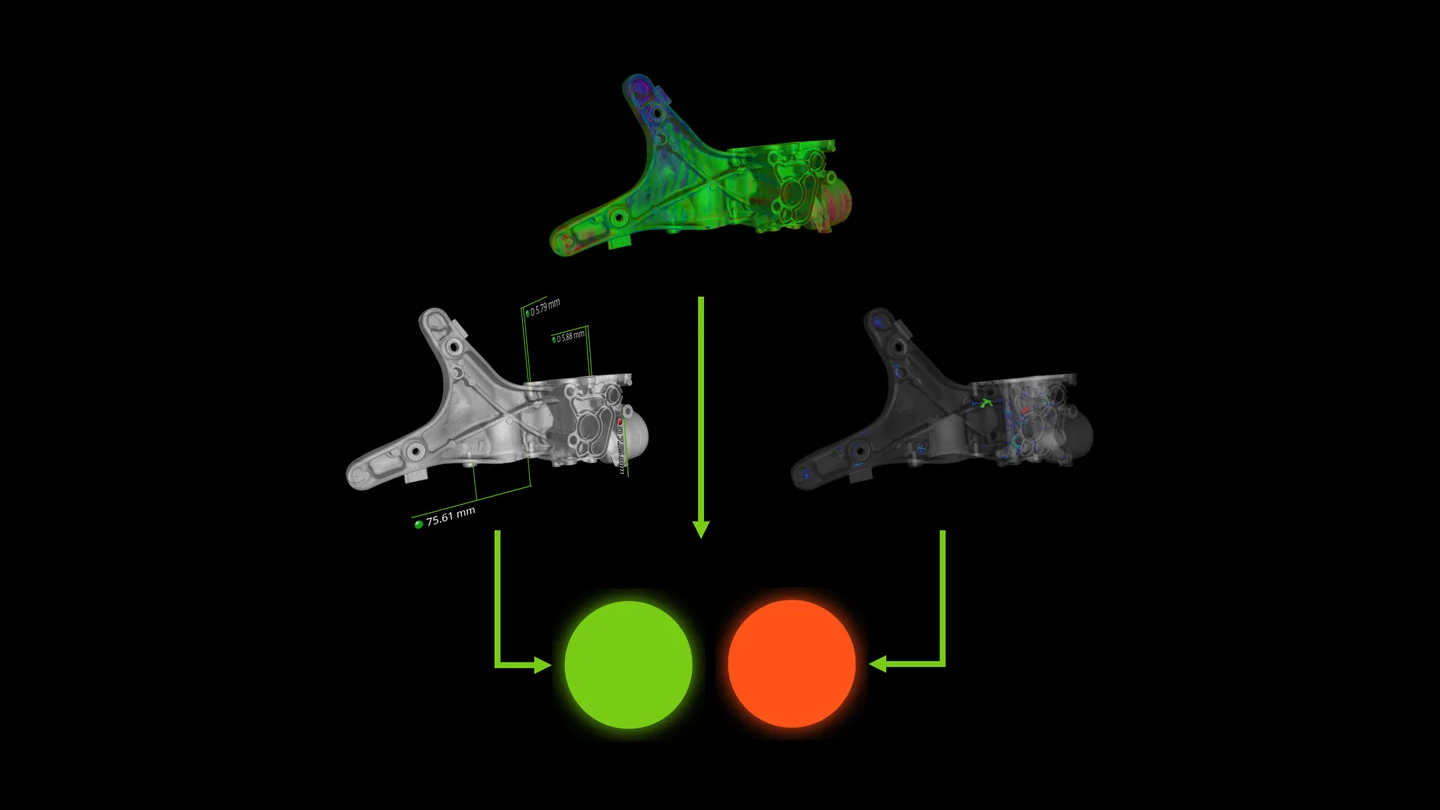
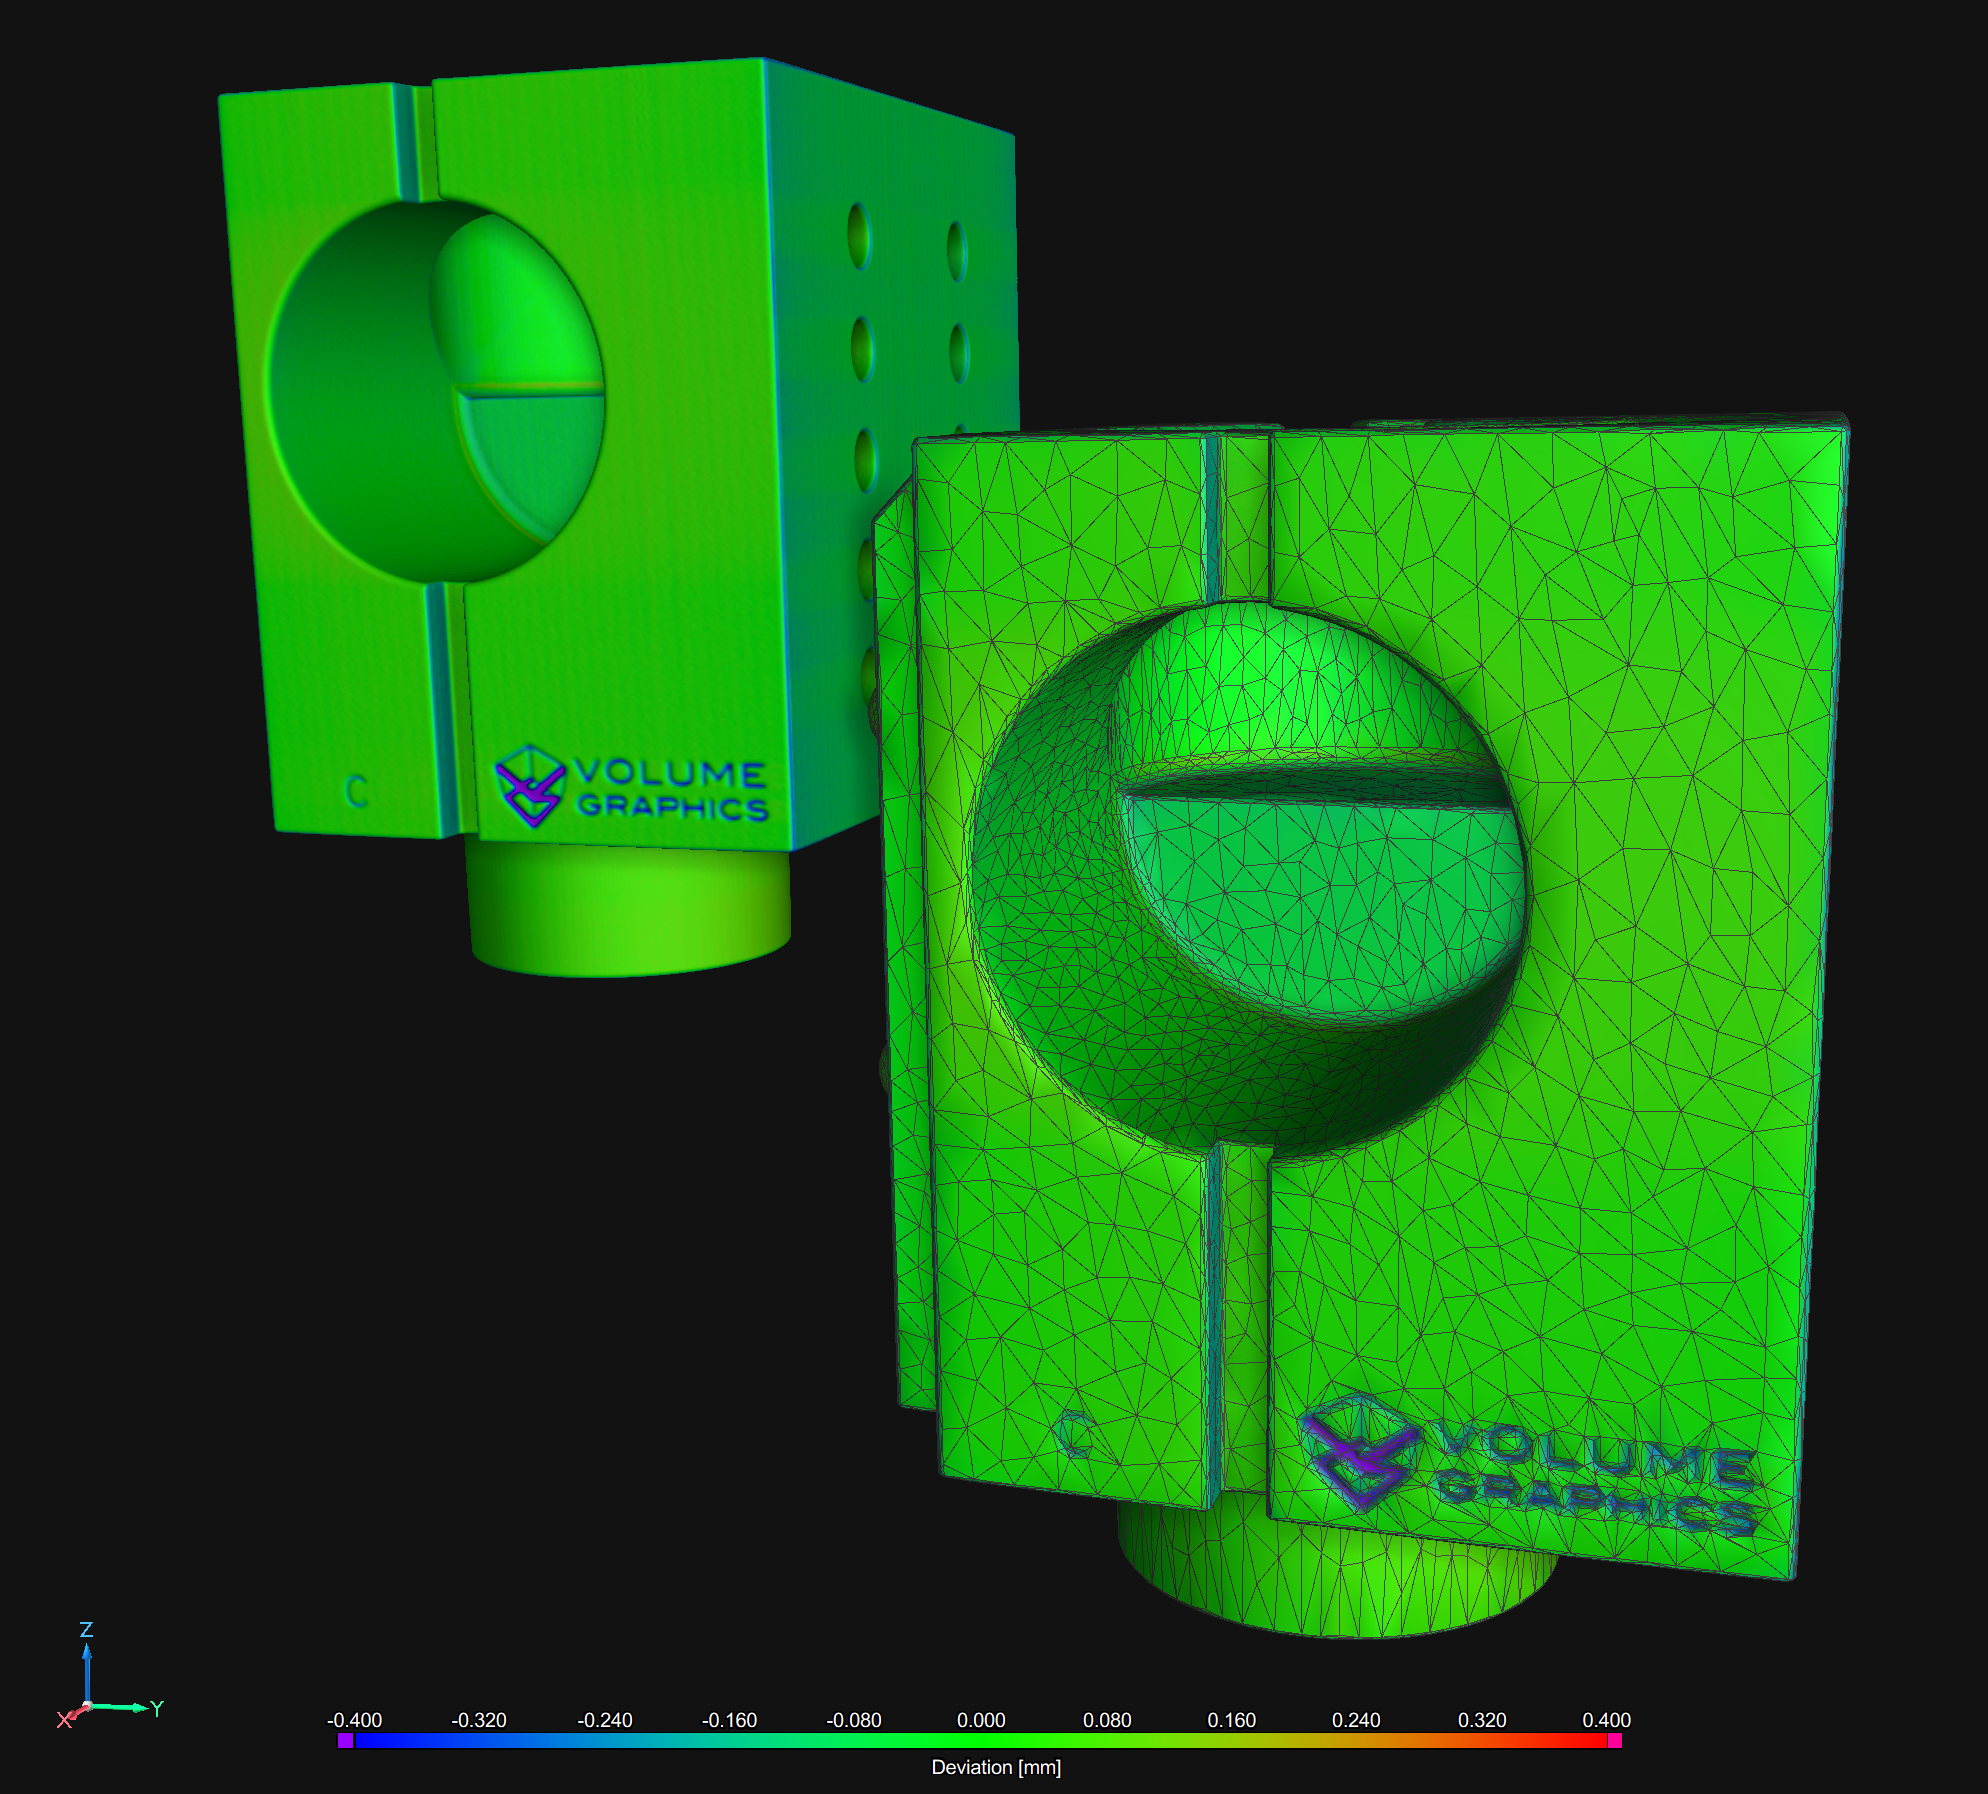
Introducing a game-changer in deviation analysis: Use your nominal part to tolerance wall thickness deviations on CT scans of the actual part. No more guessing games about wall thickness, no more relying on absolute values of the wall thickness sphere calculation.
Visualize, tolerance, report, and evaluate the real deviations between your nominal part and the actual scan. Leverage our unique adaptive transformation technology to ensure that calculated deviations correspond accurately to surface points on both your nominal and actual parts.
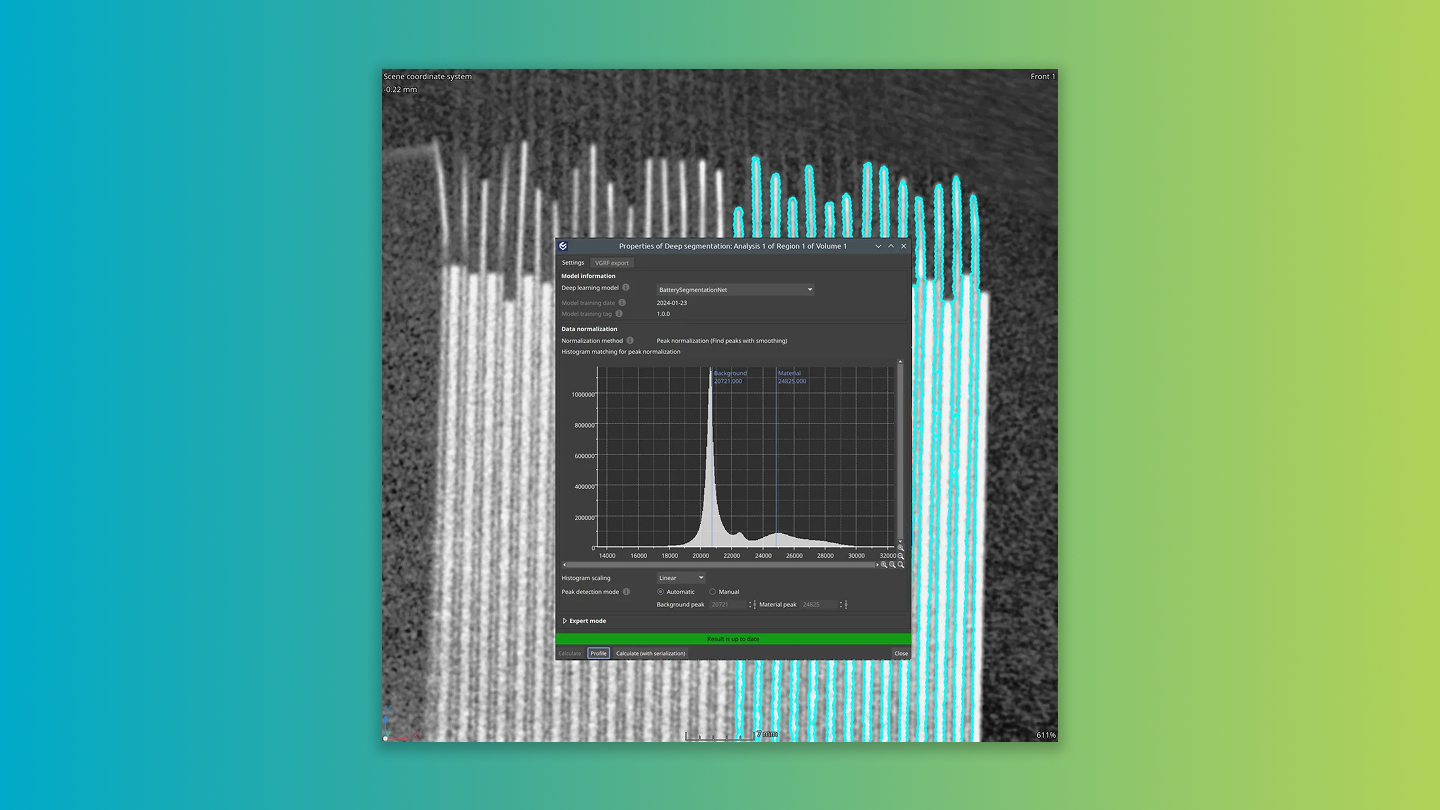
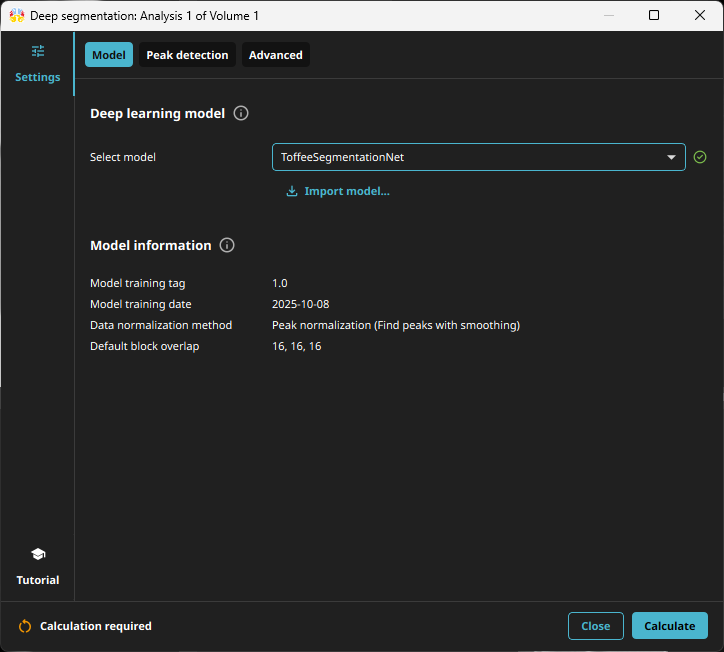
This innovative, machine-learning-based solution is tailored for noisy, low-quality data, and therefore can handle fast CT scans.
Saves time: Simplified processing lets you load data, select the model, calculate, and apply the resulting regions of interest for subsequent analyses – all in a few steps.
Ideal for automation: Designed with user convenience in mind, our Deep Segmentation tool fits seamlessly into automated inspection workflows.
Supports industry standards: The Deep Segmentation module is compatible with the industry-standard ONNX model format, empowering you to utilize problem-specific and data-specific deep learning models.
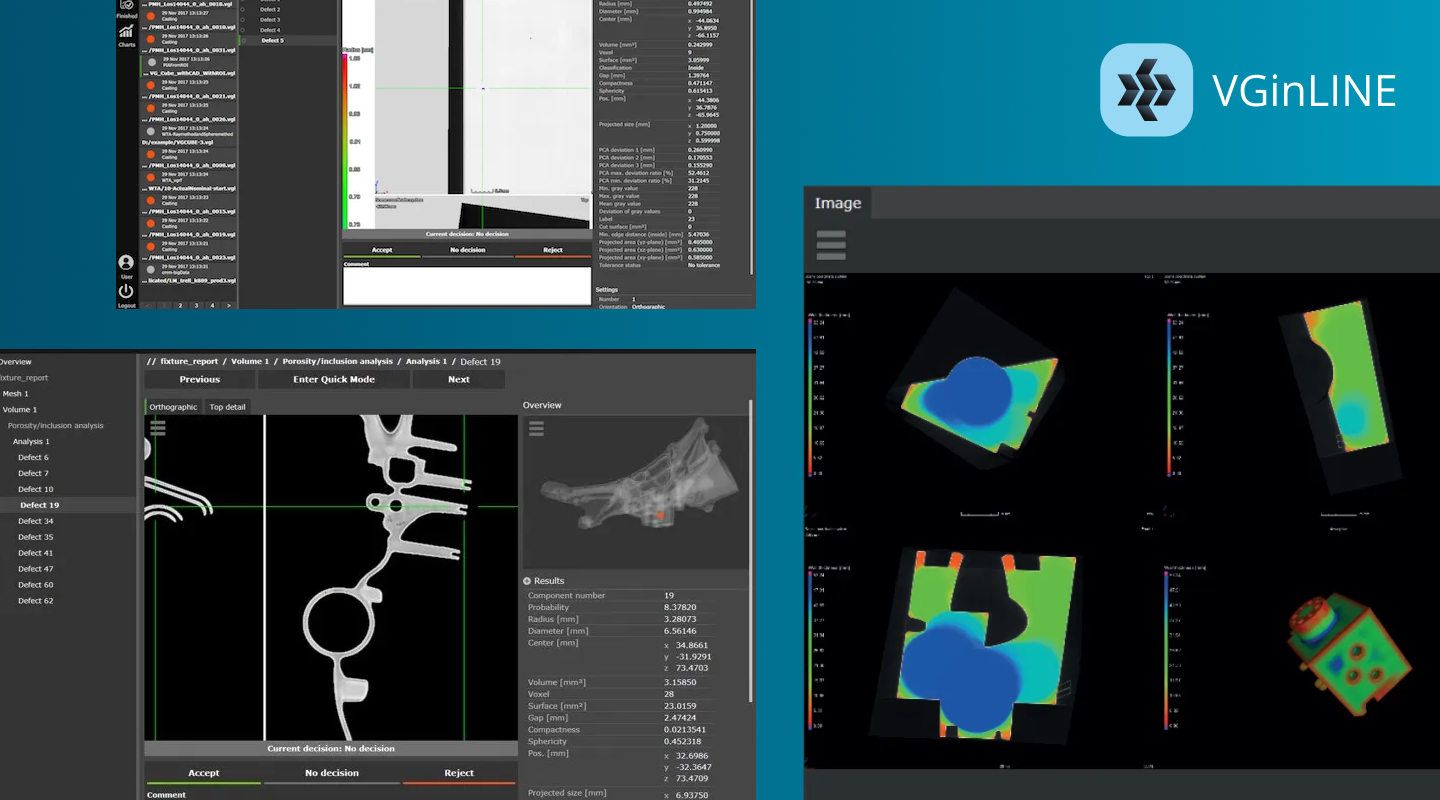
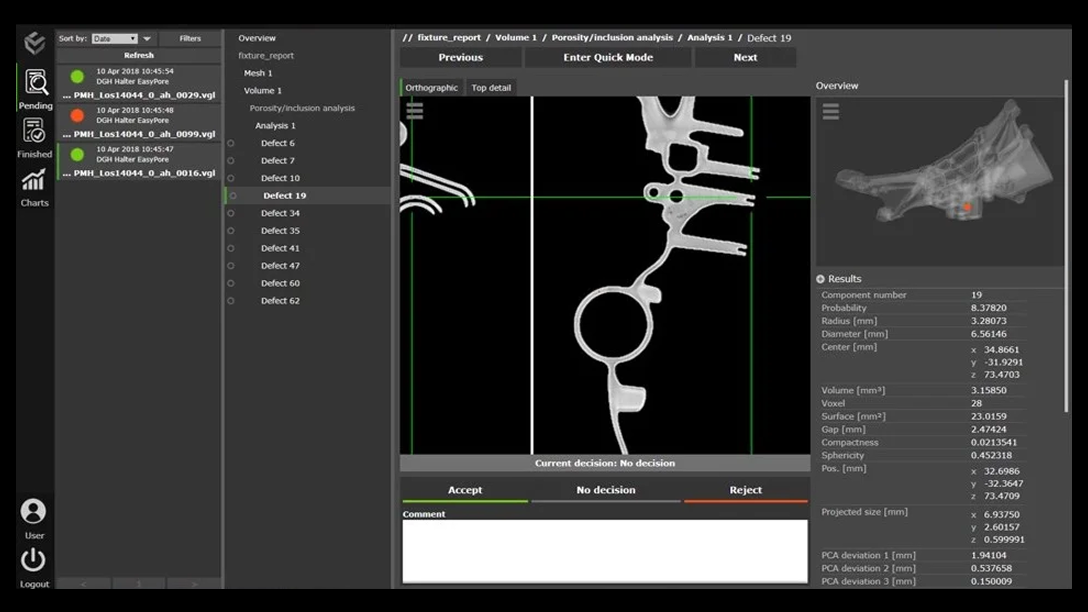
Selecting objects is more intuitive than ever: Just pick your tool of choice — rectangle, ellipse, or lasso – and directly draw in the 3D window. As soon as an object’s center of mass is highlighted, the object will be selected in the Scene Tree. Add or remove objects directly in the 3D window – WYSIWYG.
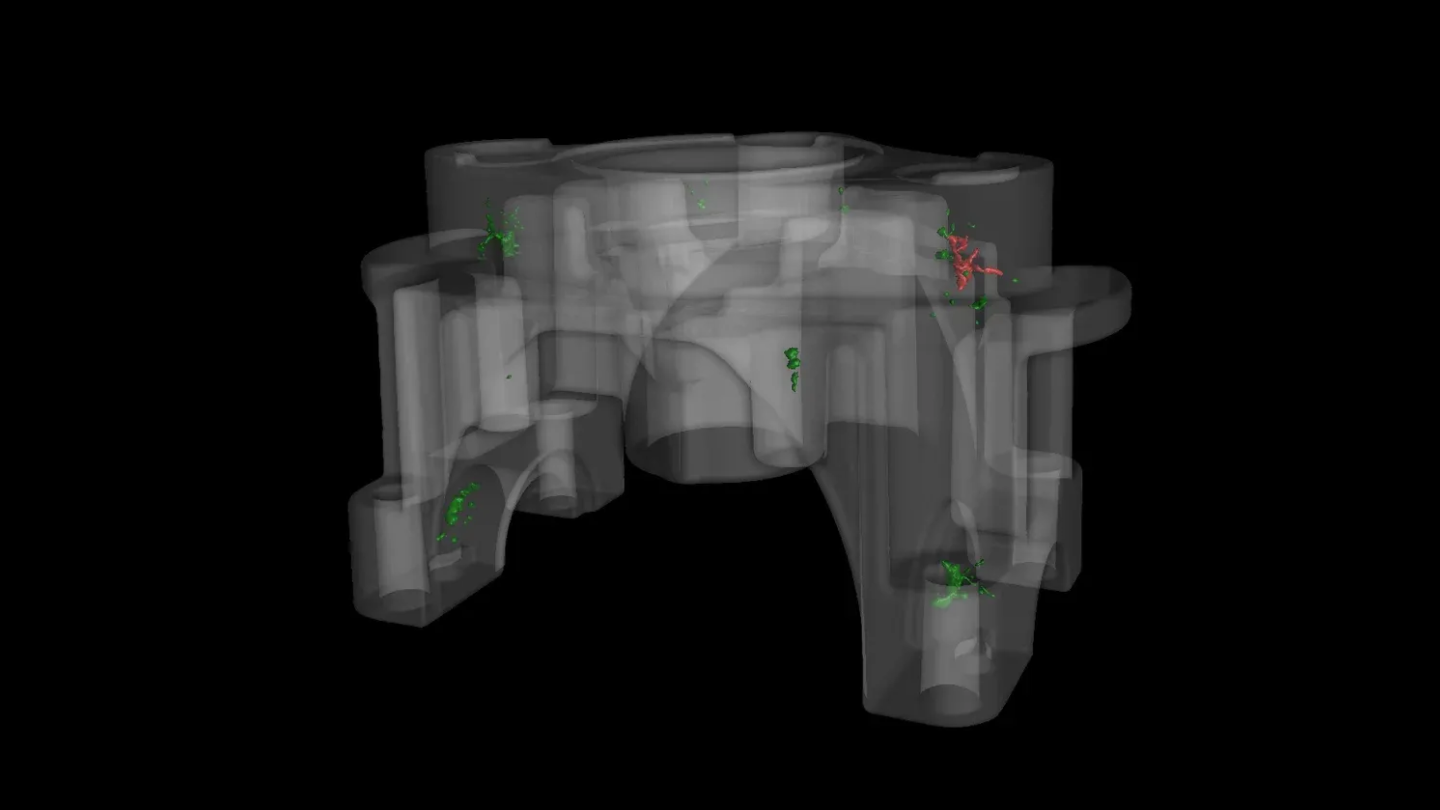
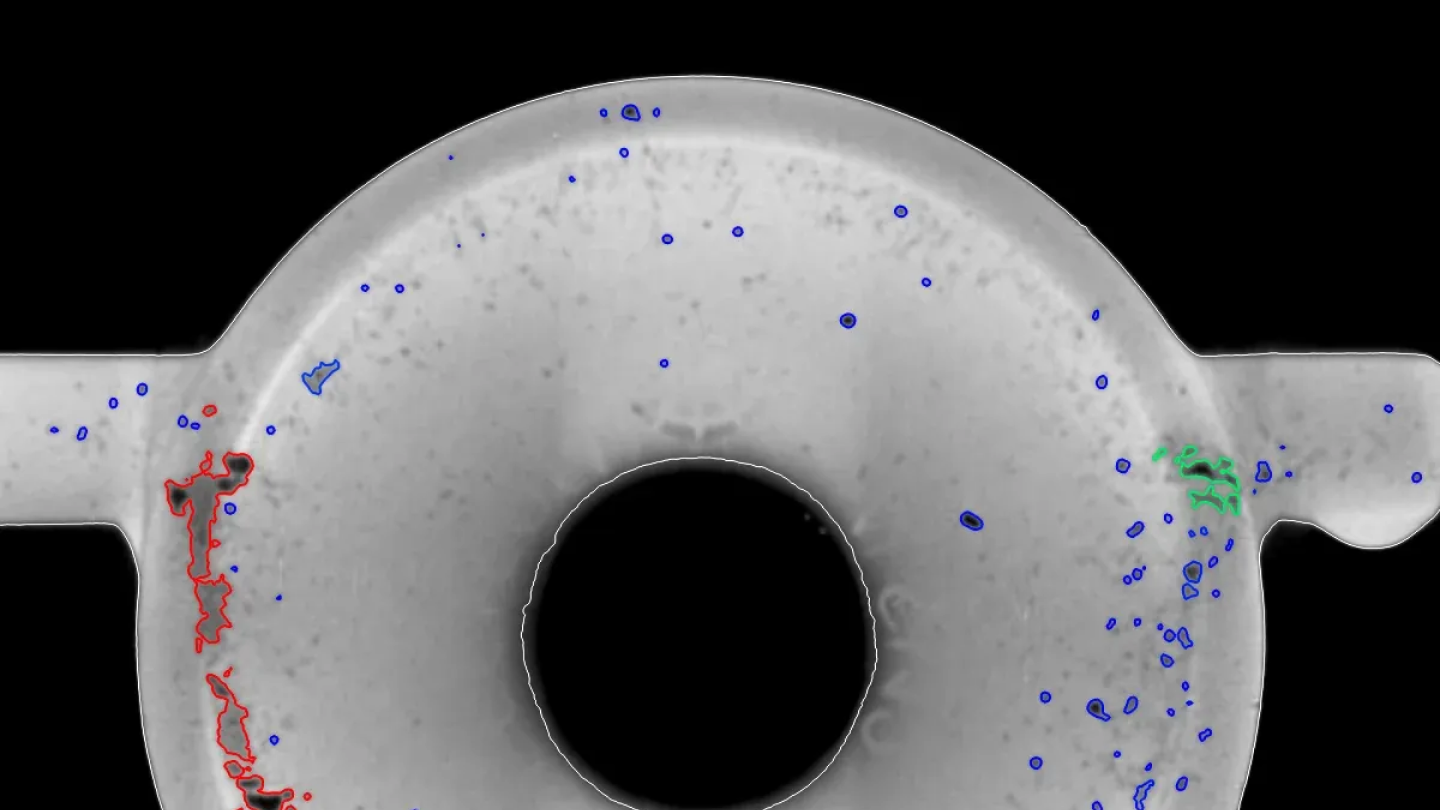
Instant tolerance status: Instantly view the tolerance status of each pore in an intuitive color-coded format. Simply select the tolerance status as "Active column" and identify the status visually using green (in-tolerance) and red (out-of-tolerance).
Quick surface determination: Forgot to execute a surface determination before starting your porosity analysis? No problem! Our new shortcut in the analysis window allows you to create a default surface determination suited specifically for porosity and inclusion analyses, ensuring a smoother, uninterrupted workflow.
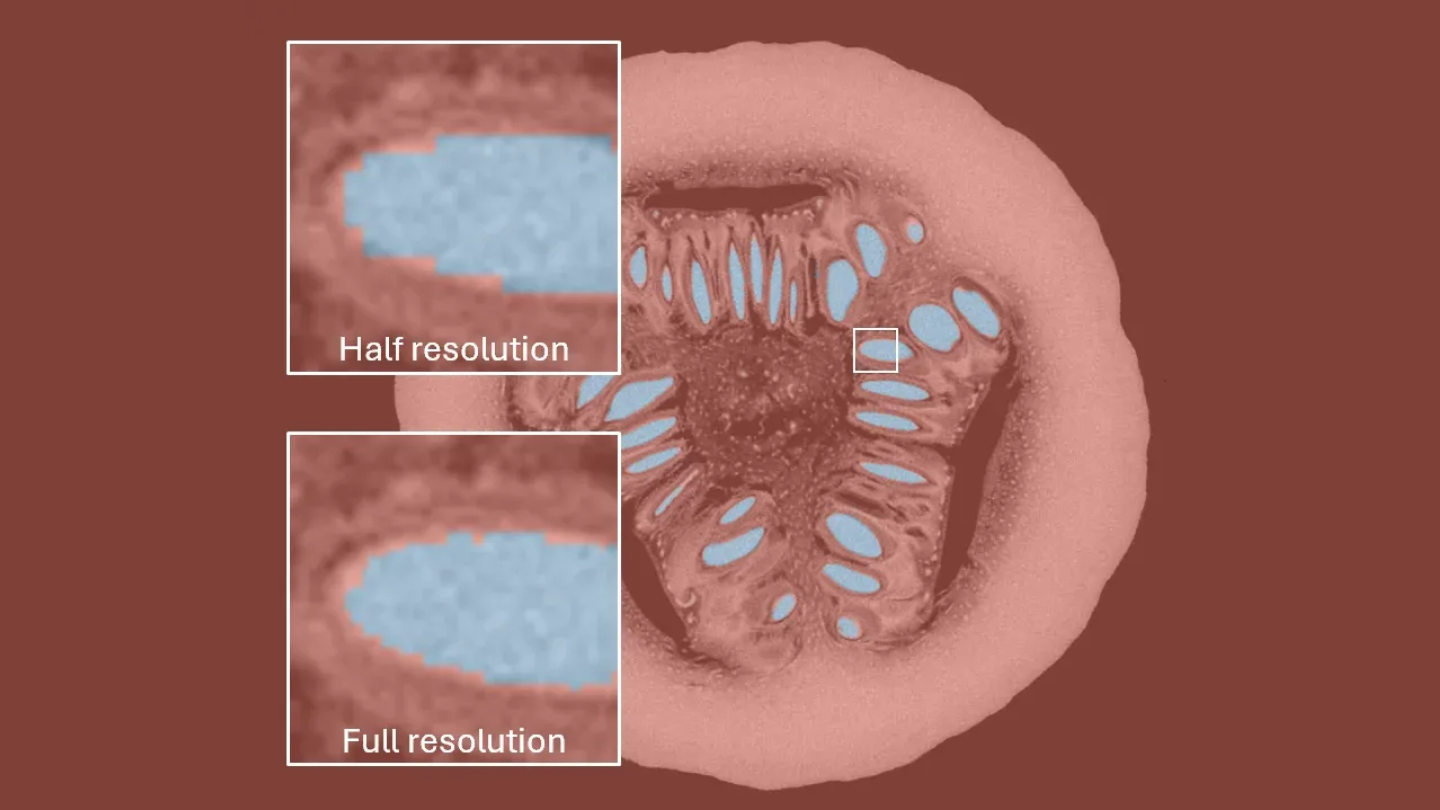
When speed is more important than exactness when using our Paint & Segment tool, reduce the resolution and get your segmentation much faster.
Opt for half resolution, and watch the segmentation run about 8x faster — freeing up valuable time for your other important tasks.
Enable or disable ROI rendering for numerous objects simultaneously! Enjoy better automation scenarios, with the toggle macro step now distinctively separated into two clear steps: "Enable ROI rendering" and "Disable ROI rendering". This ensures better reproducibility of macro jobs for a more streamlined user experience.
This dynamic feature utilizes the color bar settings configured directly in the analyses, offering an enriched context to interpret results in your reports. Elevate your reporting experience and data interpretation capacity with this unique update.
Color-code table cells in reports according to their tolerance state
You can now opt to color-code individual cells based on their tolerance status. This instant visual representation not only enhances the meaning of your result tables but also allows for quicker identification of specific indicators that caused a part to be out of tolerance. A more meaningful, intuitive understanding of your data is just a color away!
Hide info field names in reports
You can choose to hide the title of any info field in your report. This feature not only allows for seamless integration with any personalized text but also contributes to creating more succinct report pages. Enjoy more control and design freedom with our refined reporting settings.
Invalidation of bookmark images on analysis changes
Bookmark images are now tagged with an "out-of-sync" status if analysis results change. For automated scenarios, all "out-of-sync" images undergo an automatic update before saving, ensuring that the bookmark images reflect the current state of your project accurately. Experience improved visibility and control over your data with this dynamic update.
Rename objects using metainformation
You can now rename objects using one of their metainformation fields. Ideal for use in macros, this function can transfer text read from an object via OCR to its name in automation scenarios. Experience elevated control and efficiency in your data management with this latest feature enhancement.
Our new upgrade allows for macro recording of placing the fixtured object within the scene, facilitating seamless fixture simulation in fully automated workflows.
Users can now run the application and create reports in Italian, Spanish, and Russian.
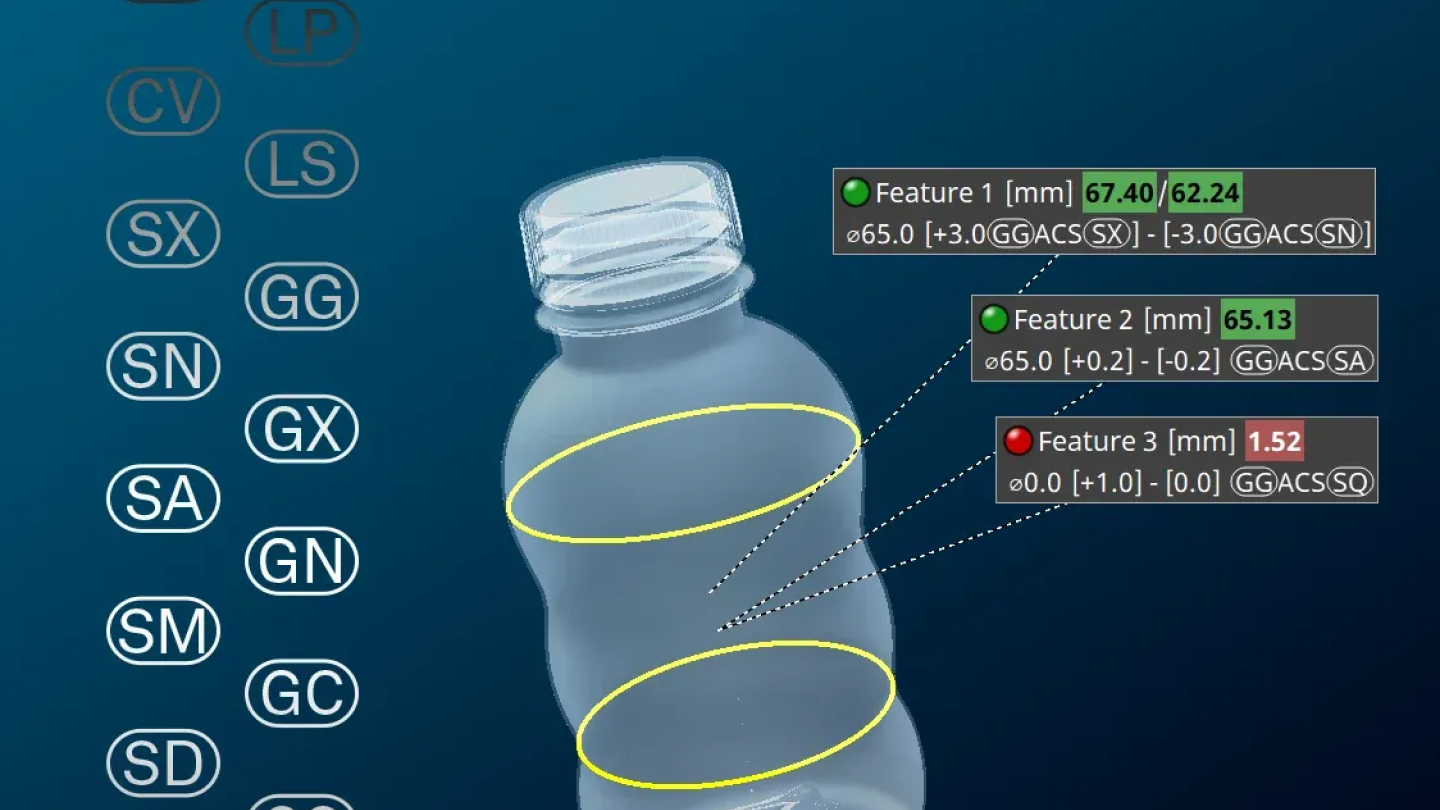
You can now measure linear sizes that require the use of rank order modifiers (for example, for the calculation of an average size) or the use of the ACS (arbitrary cross-section) modifier for the calculation of size measurements in any cross section.
Measurement tasks according to ISO 14405-1 that require the use of these modifiers can now be easily performed by choosing the appropriate modifier symbols in the "Linear sizes" dialog.
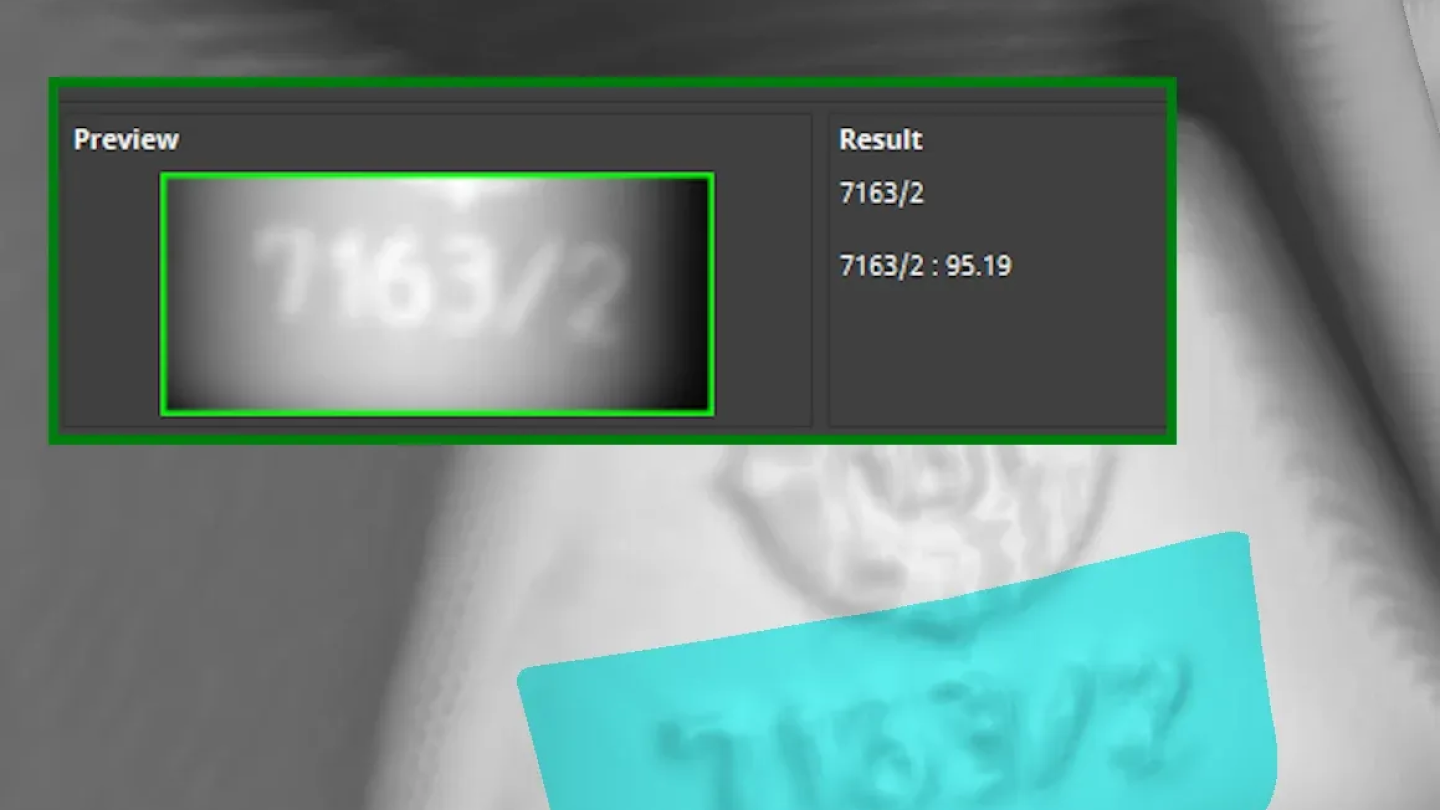
Our revamped OCR analysis significantly enhances the automatic text recognition capabilities of VGSTUDIO MAX and VGinLINE and comes with improved result customization options and reporting support. ASCII text on components will automatically be recognized and translated into the object's metainformation for use in inspection plans or reports.
While you will no longer be able to create new instances of the old OCR analysis, any inspection plans and evaluation templates that contain them will continue to work. We strongly recommend that you switch to the new OCR analysis as the outdated version will no longer be available with software release 2025.2.
You can now create regular elements for circles and two parallel opposing lines in a 2D view and use them for linear size measurements and various geometric tolerances. This is especially useful when you have to measure linear sizes in a specific cross section (SCS) of an element.
- The new "Automatic" mode for the "Analysis area" will consider the surface determination settings. This will make your daily work with the porosity/inclusion analysis faster and less error-prone.
- The visualization of pores is now by default set to "Render outline only" so you can still see the gray values of the detected pores.
- With the new default report preset "Big five," you will get images of the five largest deviations in your standard report. If you want to have more, less, or just the deviations that exceed a certain value, you can simply customize the rule on the "Rules" tab of your porosity/inclusion analysis.
- To keep the dialog of your porosity/inclusion analysis tidy, only functionally relevant tabs will be shown.
- We extended the accurate voxel-based calculation of the "true gap" between pores: you can now tolerance the real distance between pores by setting a tolerance for the "Gap" parameter
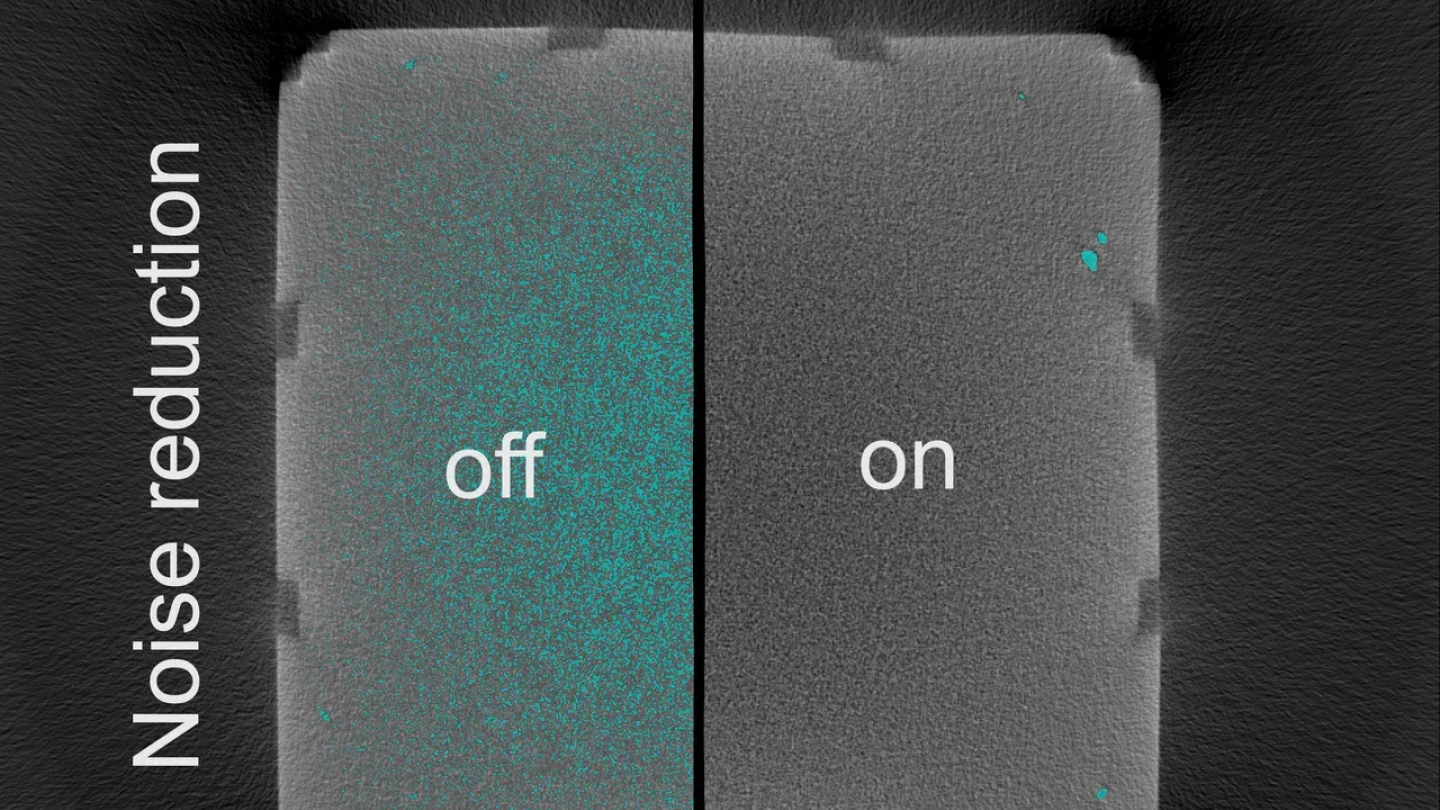
If your data is very noisy, VGEasyPore might detect plenty of noise particles. By activating the "Noise reduction" option in the VGEasyPore dialog, you can filter out noise from the very beginning. This makes it easier for you to adjust the parameters for successfully detecting porosity or inclusions.
And – unless you evaluate large amounts of tiny noise particles – the porosity/inclusion analysis can in many cases be much faster!
When you perform a VGEasyPore analysis on a small ROI (region of interest) – for example, when there are multiple components in the CT scan and you want to perform the analysis only on one of them – VGEasyPore will now run faster than before, depending on how much of the full scan data is covered by the selected single component.
When series-testing the anode overhang in battery cells with the Battery Analysis module of VGSTUDIO MAX, you can now export the toleranced anode overhang properties in Q-DAS format. This allows you to use the analysis results in the Q-DAS software for statistical process control, for example, for process or machine capability analysis or for monitoring the results over time (trend analyses).
The computation of deformation fields can now be automated via macro. This way, you can save time in your daily work when using deformation fields for the “Morph mesh” or the "Compensation mesh" function, or for adaptive ROIs or coordinate measurement templates.
You can now directly import newer NSI formats, without the need for an extra tool. This makes working with newer NSI formats easier and more robust.
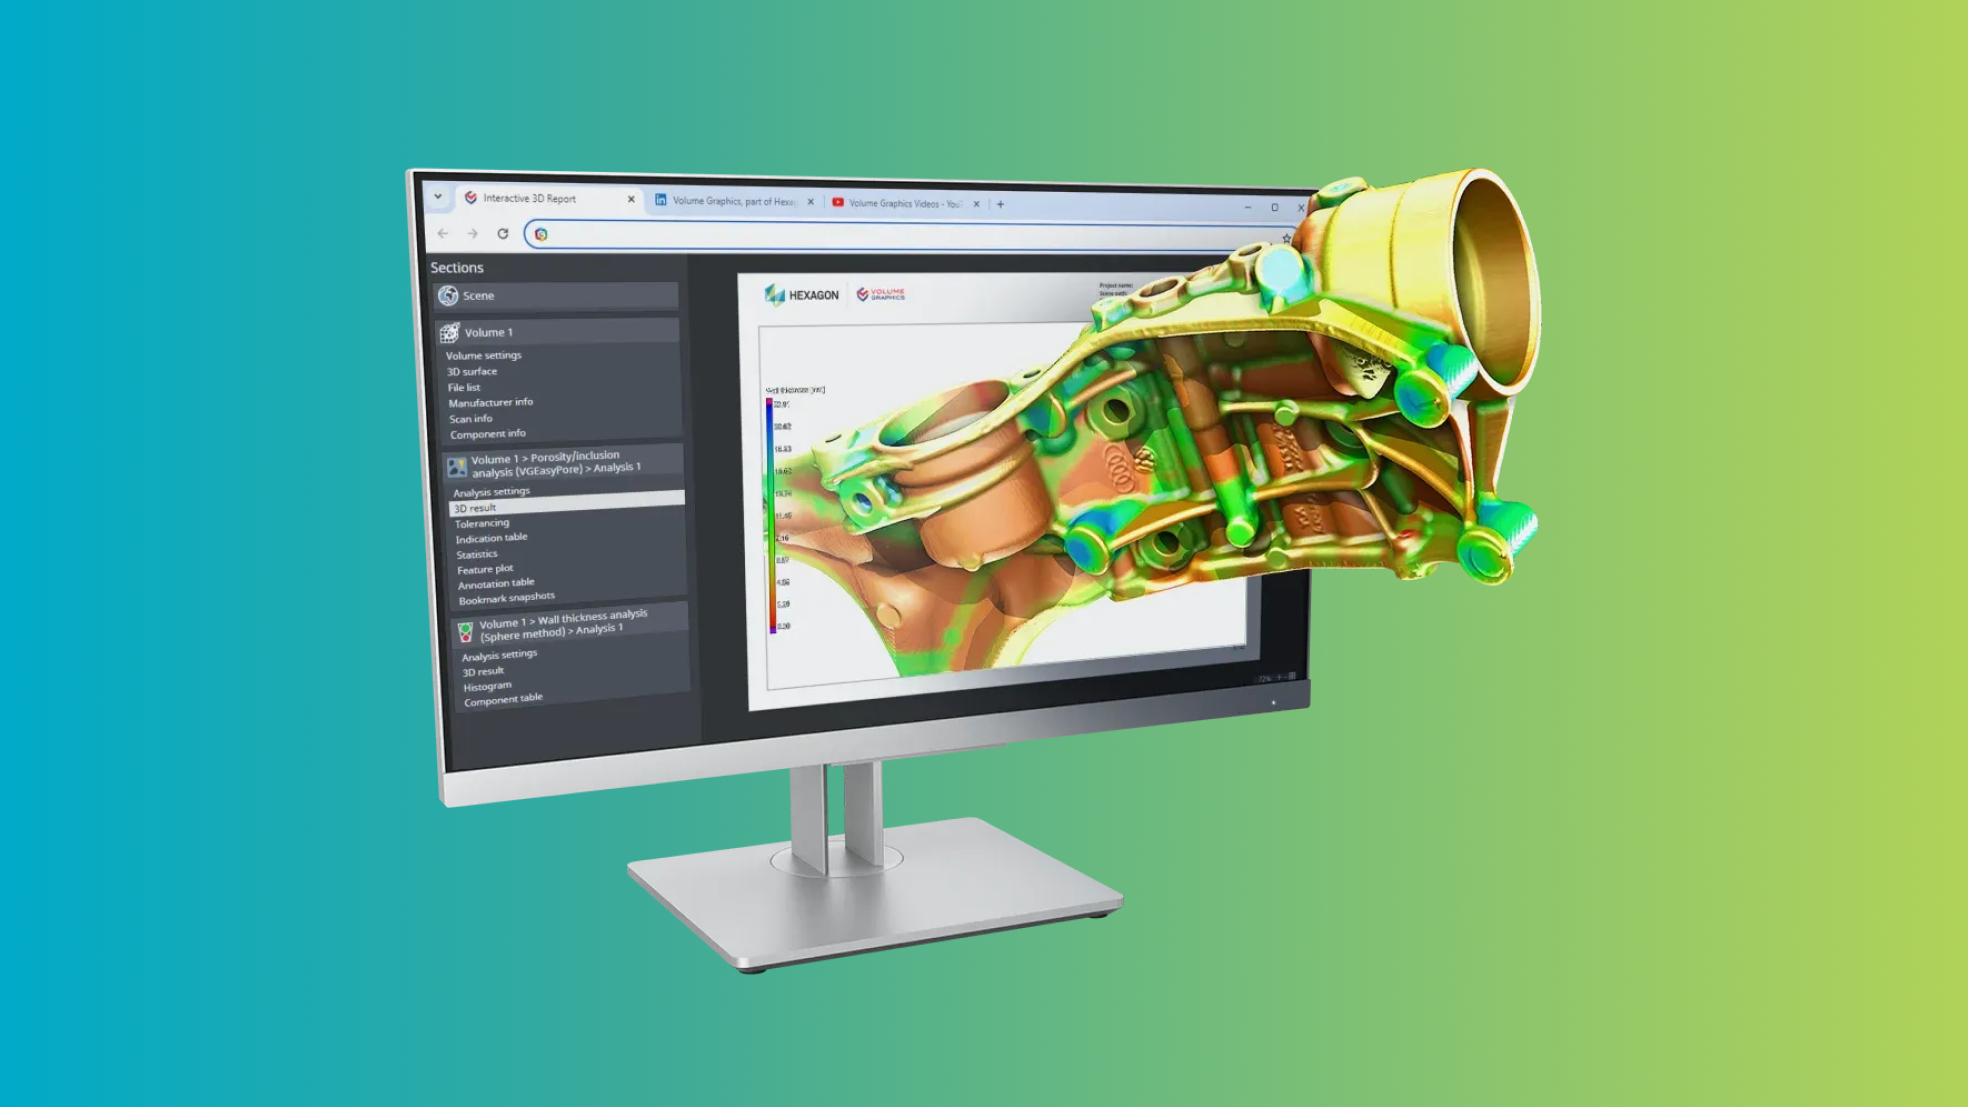
Sharing comprehensive inspection results just became even easier. The new HTML format is an all-in-one solution that also supports interactive elements, like part or result 3D views. These self-contained documents eliminate the need for a separate viewer application and are easily accessible with any Chromium-based browser like Edge or Chrome.
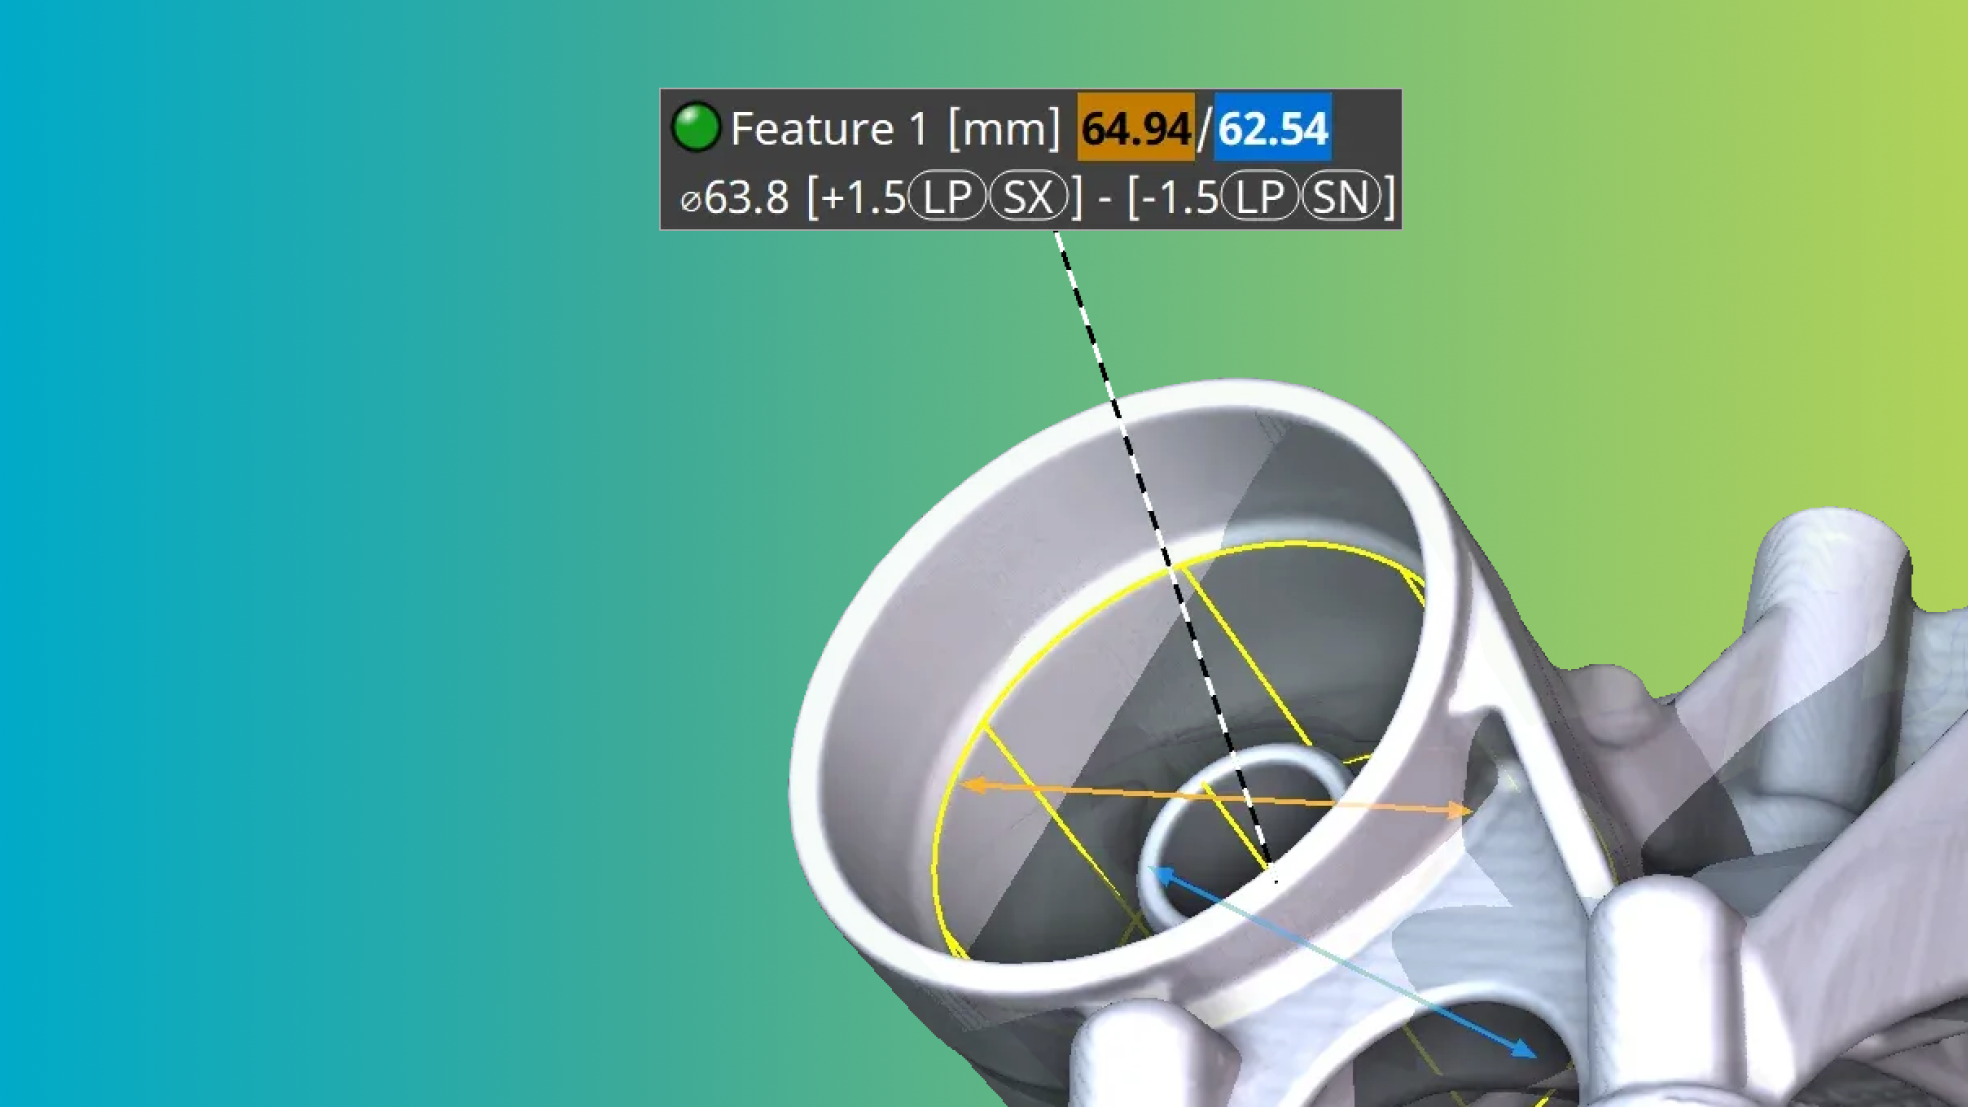
Simplify standard conform measurements with direct support for modifier symbols. These include two-point measurements [LP], the envelope requirement (E), and global modifier symbols like [GG], empowering easy evaluations for many size features.
You can now specify the sphere radius in length units, even on anisotropic data sets. Enjoy significantly boosted performance, reaching computation speeds that are more than 50 times faster — specifically noticeable when utilizing larger radius values.
PNG format for streamlined image stack import and export
You can now bypass the need for additional file conversions when using PNG as a storage or data exchange format. Enjoy a faster workflow for importing and exporting your volume data.
New DICONDE export
Volume data can now also be exported in the DICONDE format, which includes the existing tags. For volumes that were not imported from DICONDE, the necessary tags are created on the fly.
Experience better image saving capabilities with native PNG format support, our new feature allowing lossless compression and 3D view images that include an alpha channel. Spice up your presentations with partially transparent images that pop!
In the past, transferring metainformation like DICONDE tags between different volumes in a scene was impossible. With this feature, you can now easily move this essential information, even when creating entirely new volumes from initial scan results. This enhancement ensures traceability is maintained throughout your process, keeping your work consistent and structured.
Improved VGEasyPore relative mode
We've improved the relative mode in VGEasyPore to enable easier and more precise pore detection. This updated version* empowers precise pore identification with locally adaptive results, all by simply setting a contrast percentage without the need to manage absolute gray values. The default contrast value of 20% is suitable for most datasets, often eliminating the need for any further adjustments.
*The previous relative mode is still available, ensuring you can still seamlessly run existing analyses and VGinLINE jobs.
Faster VGEasyPore
VGEasyPore now runs up to three times faster on datasets with many small potential indications**. This significant performance boost will save your valuable time when working with noisy data, making your process more efficient than ever before.
**While the voxel count and number of smallest indications may differ to past results due to the new voxel-exact calculation, the volume and shape features of the detected indications in the results table is not affected and will not change.
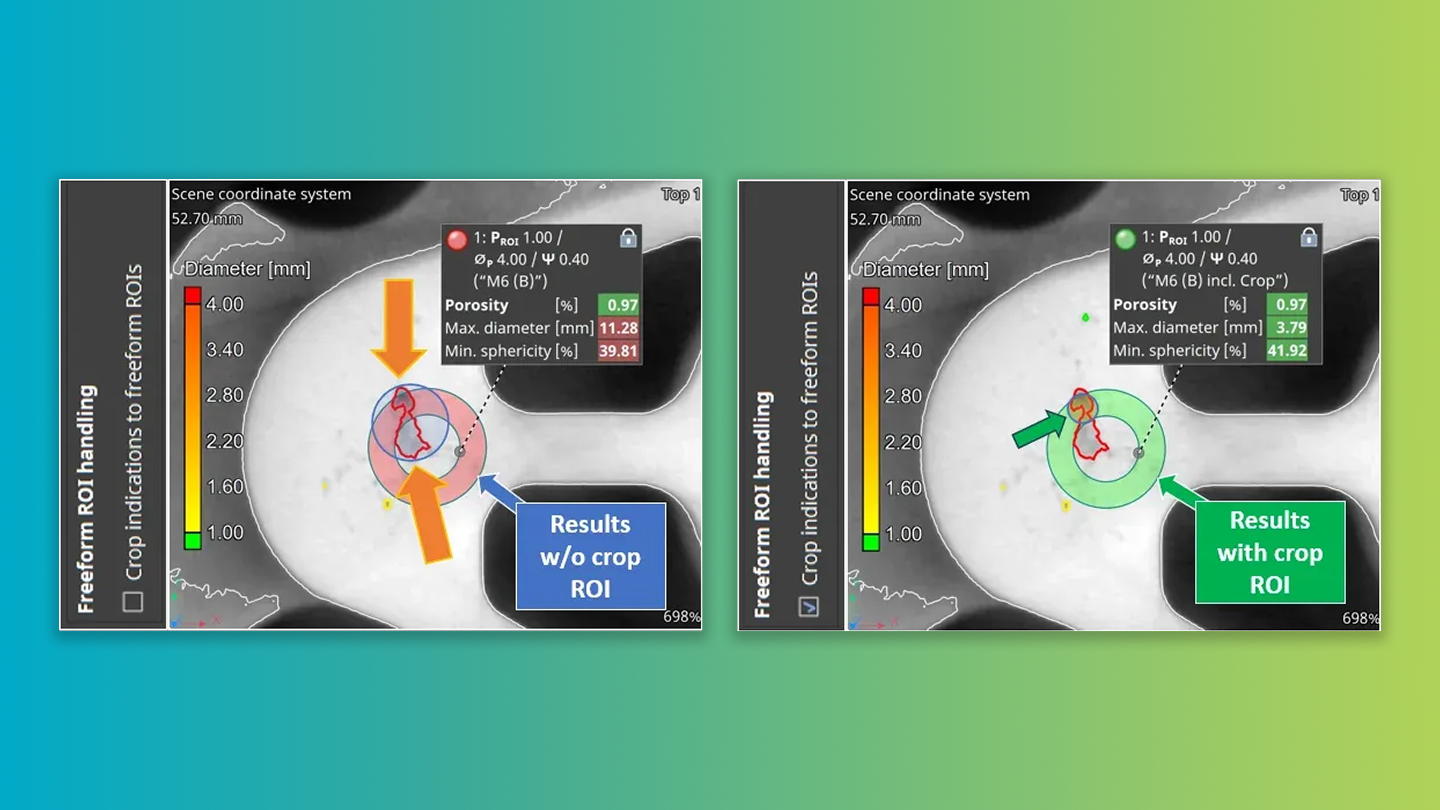
With the new function "Crop indications at freeform ROI edges", you can now decide whether pore feature parameters should only be evaluated within the ROI boundaries or, if desired, also within and beyond them. This applies in particular to detected pores that are intersected by the ROI boundaries and has a huge impact on the results of the porosity analysis on an ROI toleranced with a P 203 porosity key.
The new setting enables a foundry-related, application-specific customization of the porosity evaluation with regard to the application of the P 203 porosity key code to selected ROIs to avoid false-negative analysis results*.
*It is also the new default, but if you rely on the old behavior, you can disable it for newly created analyses. Existing analyses and evaluations will have it already disabled, to maintain consistency with previous versions.
Read the basic requirements below or download the PDF for the complete system requirements for VGinLINE.
Windows 11 Enterprise 64-bit
Windows 11 Professional 64-bit
Minimum: x86-64 CPU with instruction set SSE 4.1. ARM processors are not supported.
Recommended: Performant Intel or AMD multi-core processors, e.g., Intel® Core™ i7 or i9 or Xeon® Gold processors with 3 GHz or higher.
Minimum:
VGinLINE requires a minimum of 4 GB of free memory. However, the actual free main memory needed for creating or loading a complete project will usually be significantly higher, since it depends on the size of the data set and the analyses to be performed.
Recommended for professional use:
- 16-bit data set with 1024 slice images. Slice image with 1024 x 1024 pixels. 1024³ = 2 GB of data
=> Visualization only: minimum 4 GB free memory
=> Data analysis: 8–16 GB free memory - 16-bit data set with 2048 slice images. Slice image with 2048 x 2048 pixels. 2048³ = 16 GB of data
=> Visualization only: minimum 32 GB free memory
=> Data analysis: 64–96 GB free memory - For performing advanced analyses, such as transport phenomena or structural mechanics simulations, a free memory of 50 GB or more is recommended.
- Typical for industrial use with data set sizes as in the examples above (2 to 16 GB) is a PC with at least 64 (for one data set) to 512 GB RAM (for multiple data sets). Higher RAM clock speeds are recommended.