Volume Graphics software gives you results you can use right away, including insightful graphics and comprehensive reports: from the export of images, histograms, and data tables in common file formats to the creation of comprehensive and completely customizable inspection reports and even interfaces to third-party quality management or statistical process control software. The reporting features are a great way to share the wealth of information that VGSTUDIO MAX gives you about your scanned part.
Inspect and measure your parts using a multitude of gray value and surface-based analyses and coordinate measurement features.
VGSTUDIO MAX gives you many options to create and define content for your reports. Create documents that summarize your data at a level of complexity that is suitable for many different audiences and consumers, even if they're not using VGSTUDIO MAX.
With VGSTUDIO MAX, you can:
- Inspect and measure your parts using its multitude of gray value and surface-based analyses and coordinate measurement features.
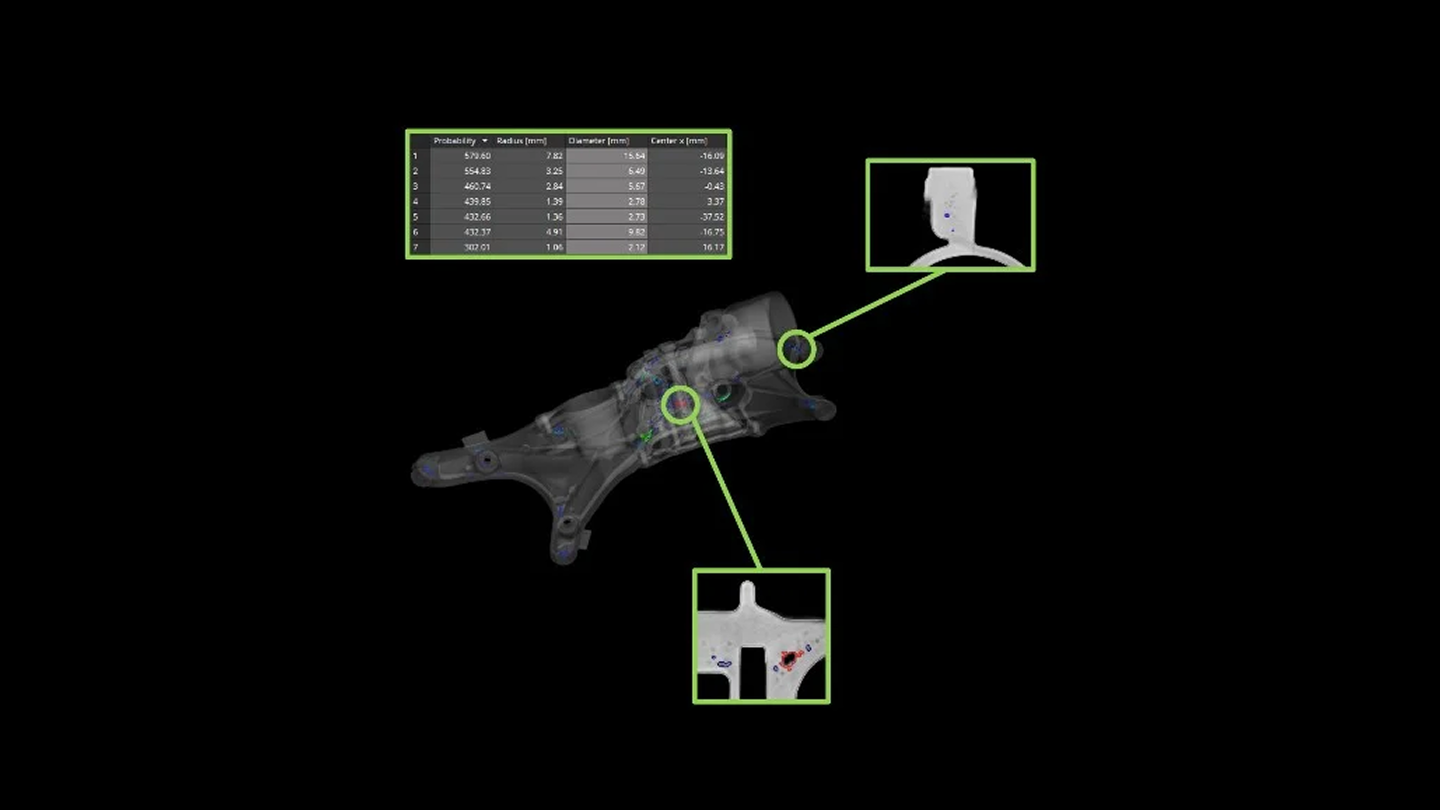
- Generate additional content for relevant areas and results by defining rules that automatically create images or interactive markers according to certain result features like tolerance states or defect sizes.
- Add arbitrary views to your reports that make use of all the advanced visualization capabilities in VGSTUDIO MAX and are transferrable between different inspections projects.

Customize your reports using the integrated WYSIWYG editor.
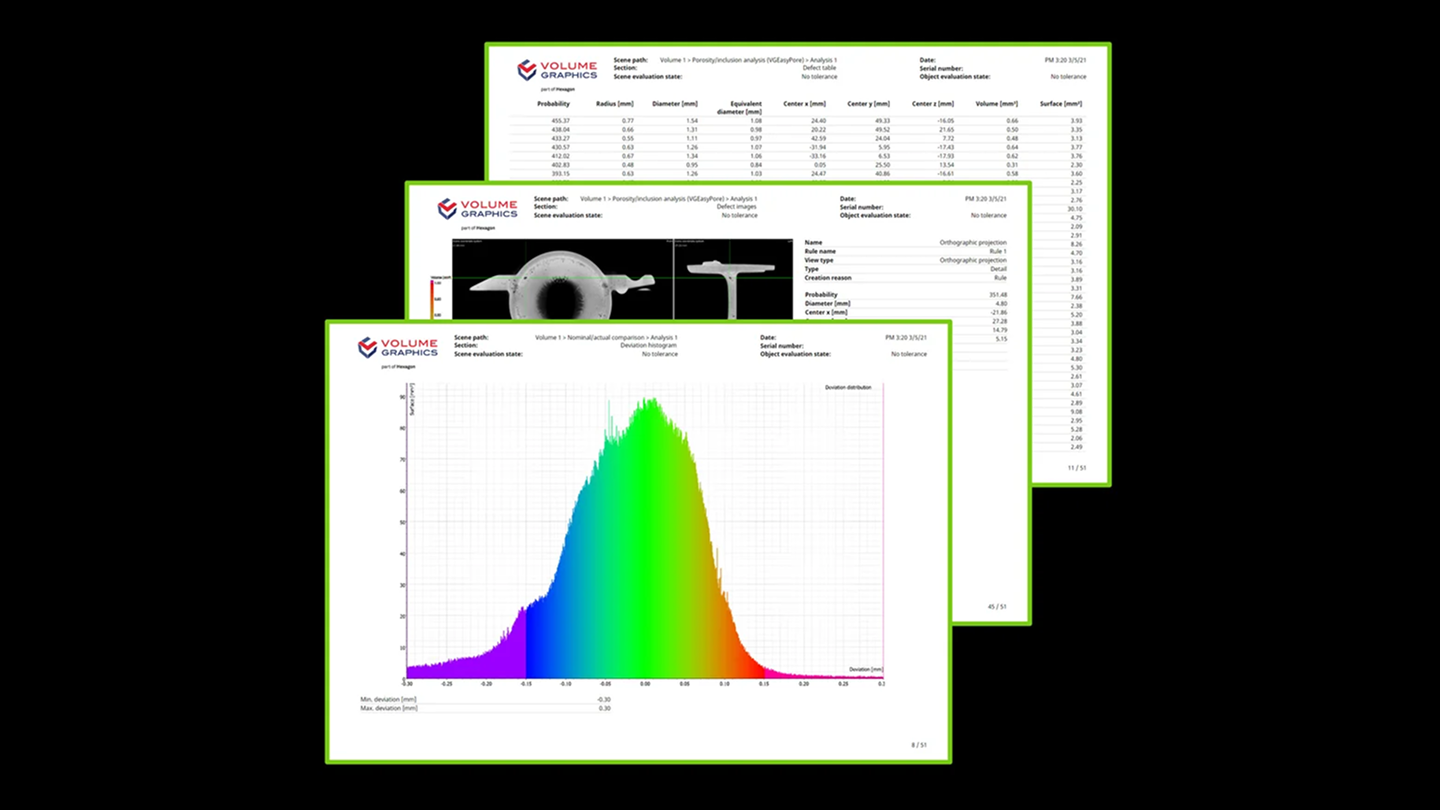
Generate audience-appropriate reports that focus on numerical results, images, or combinations of both with the integrated reporting function.
With the integrated reporting function, you can:
- Pick and choose from your results and related content.
- Customize your reports using the integrated WYSIWYG editor, e.g., configure the displayed content, add images or project information to all report pages, or select which table columns to display.
- Store reports as a self-contained PDF that can be easily archived or shared.
- View the report directly in VGSTUDIO MAX as part of the full inspection project.
Adapt layout templates to display results according to your specific needs.
Create fully customizable reports directly from within VGSTUDIO MAX using the add-in for Microsoft Excel developed by Volume Graphics.
With reporting via Excel, you can:
- Adapt layout templates to display results according to your specific needs.
- Derive and display additional data from the reported content using powerful Excel formulas.
- Share adapted templates with colleagues, across company sites, or keep multiple versions to generate personalized reports for individual customers
VGinLINE APPROVER
Automatically apply inspections to all incoming scanned parts and transfer results to a database to make them available in the VGinLINE APPROVER web application.
With VGinLINE APPROVER, you can:
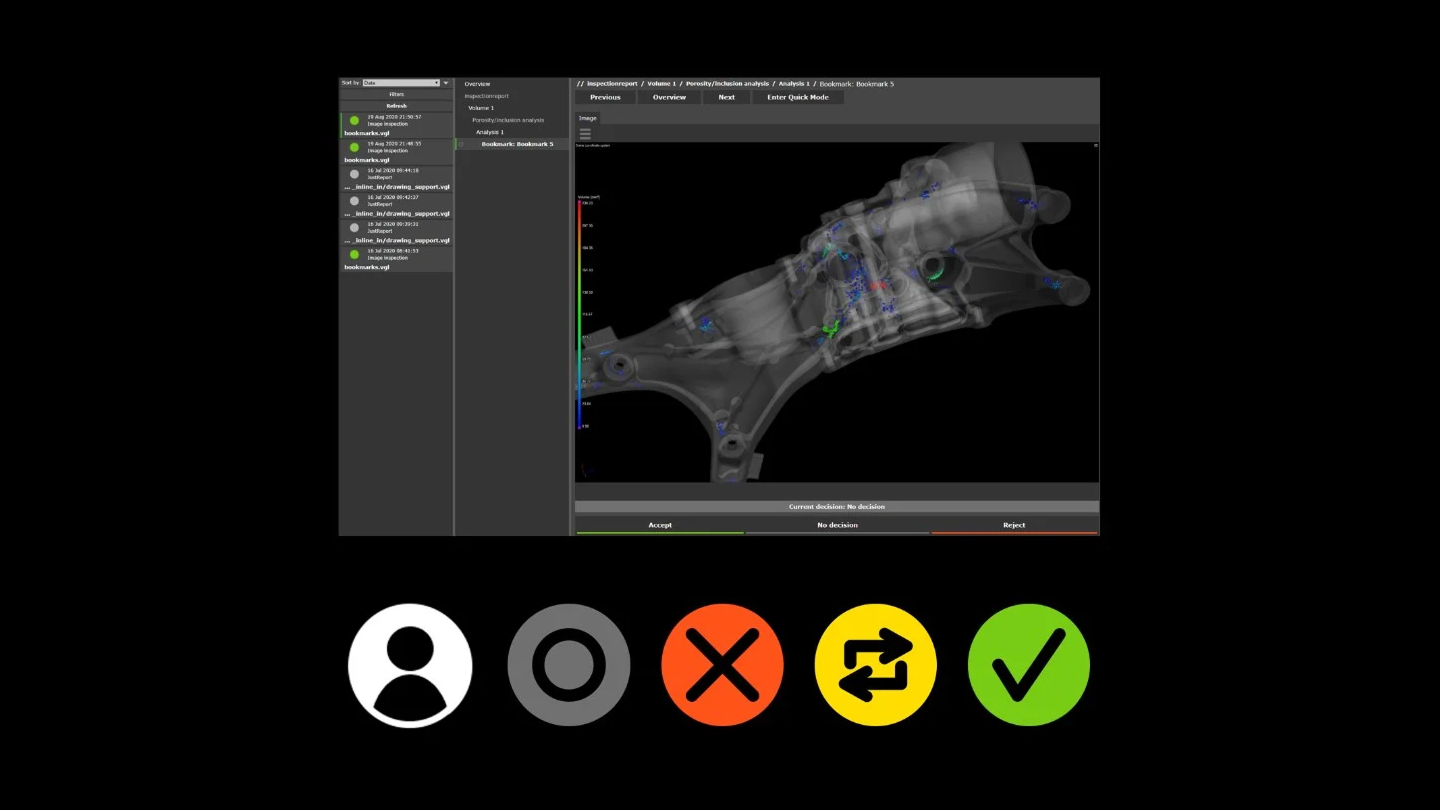
- View the numerical or image results of stored inspections, display result positions on interactive 3D models of your part, and plot comparable results across different inspections.
- Enter comments or pass/fail decisions that can be exported in an interface format for use in other applications, and which are traceable to individual, password-protected user accounts

Export complete coordinate measurement results or analysis data in the industry standard Q-DAS format.
Put your results to good use in other systems. Q-DAS and raw data export allow you to use your data as input values in other applications, for example for statistical process control.
With Q-DAS and raw data export, you can:
- Export complete coordinate measurement results or analysis data in the industry standard Q-DAS format for data interchange.
- Integrate CT result data generated in VGSTUDIO MAX into your existing processes for statistical process control and production monitoring.
- Connect results, meta data, and manual reviews to third-party software solutions using the open .csv-based Volume Graphics report format.
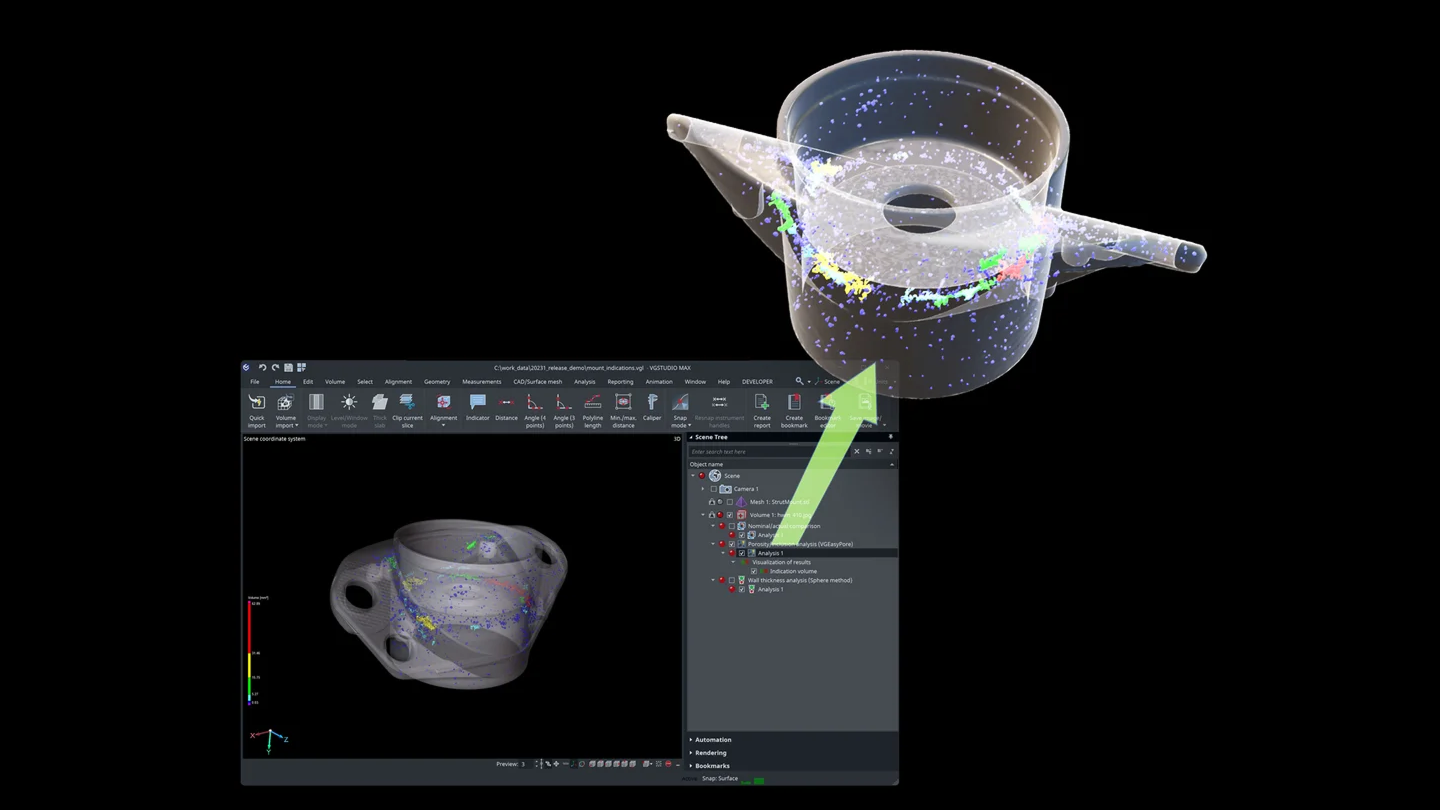
The new "Results as textured mesh" option exports the results of supported analyses (currently porosity/inclusion analyses, nominal/actual comparisons, and wall thickness analyses) as .glb files. Seamlessly transfer your results to other software, such as Windows 3D Viewer or PowerPoint, to visualize 3D objects. Unlike exporting colored meshes, this new option uses textures instead of vertex colors, which results in much smaller file sizes and smoother support in third-party applications.
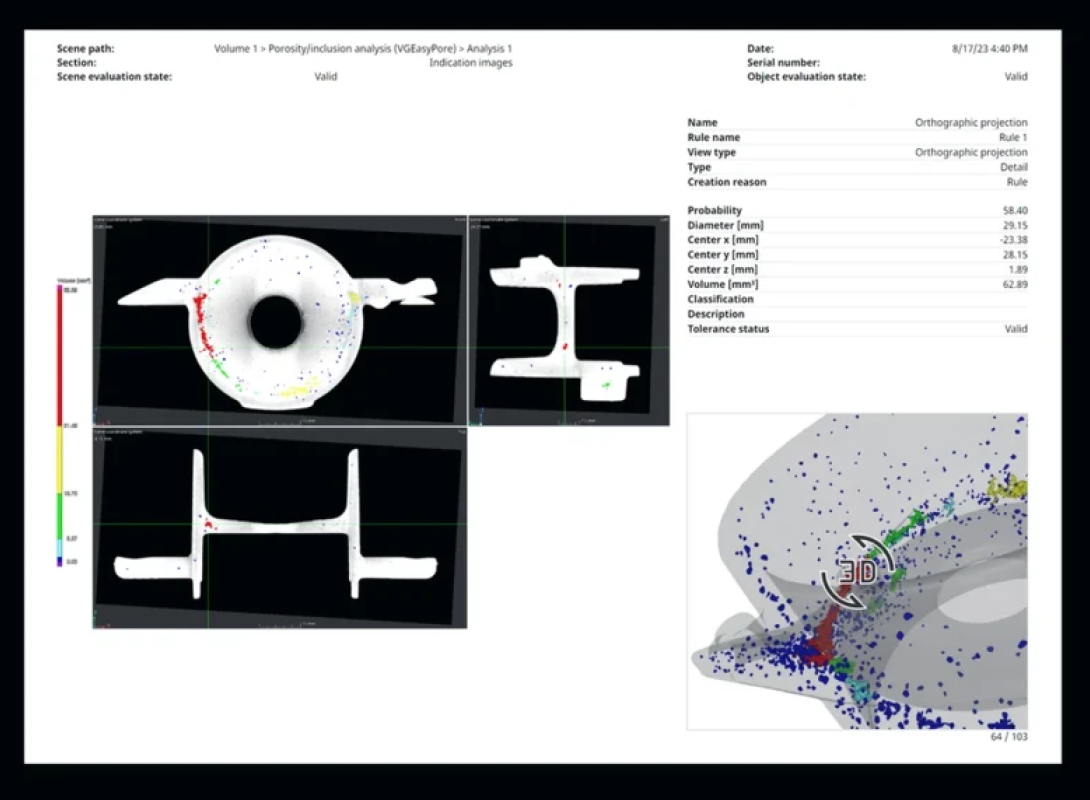
Informative combination of traceability data, numerical results, and 2D images.
Customizable content and level of detail for management or technical experts.
Connectivity to third-party systems for all reported data.