
Foam Analysis
In large or high-resolution foam samples, there can be millions of cells, which makes it nearly impossible to separate them manually and challenging to handle such a huge amount of data. The easy-to-use foam analysis features in VGSTUDIO MAX allow you to quantify such structures and derive meaningful statistics for your application.
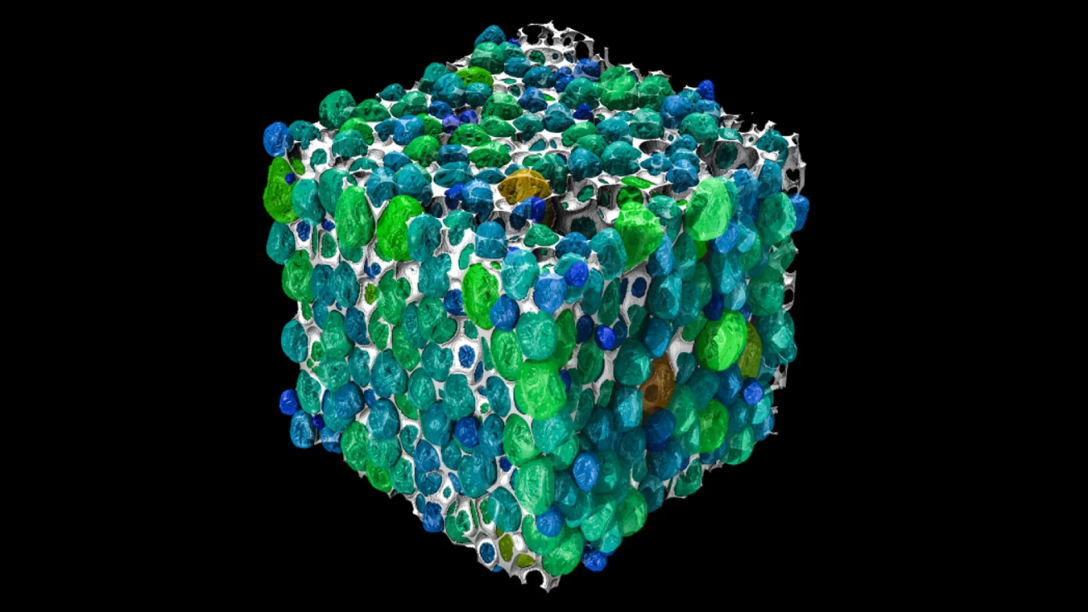
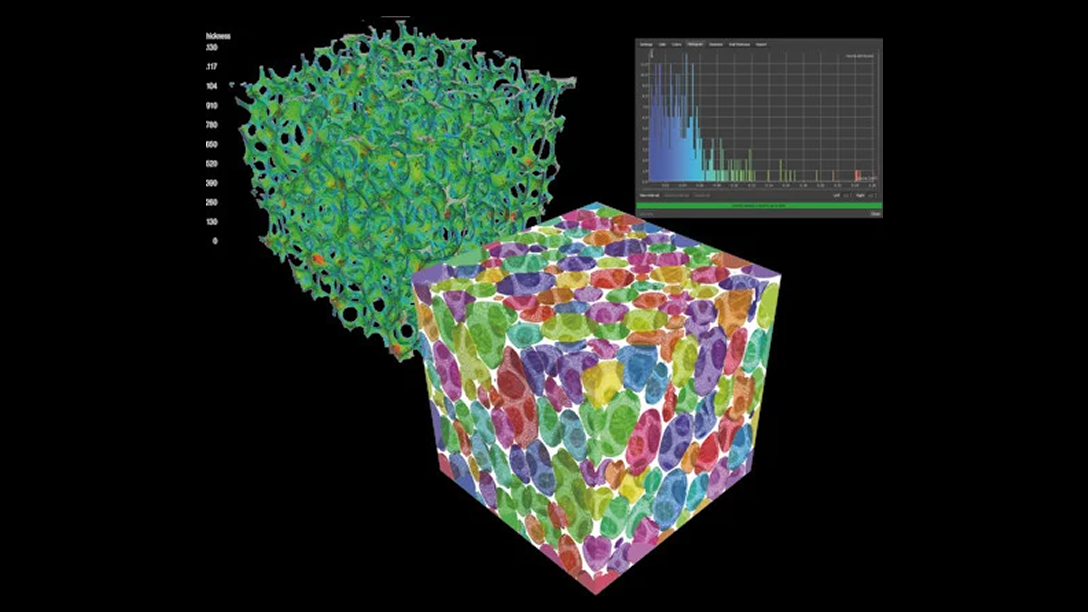
Separate and characterise individual cells within structures, such as open and closed cell foams, to quantify them individually, visualise strut thicknesses locally, and aggregate both strut thicknesses and cell properties to global statistics, such as histograms or scatter plots.
Foam analysis functions for determining features on a single-cell level
Cell features
You can determine the following features for each cell:
- General:
- Position
- Mean grey value
- Size:
- Volume
- Equivalent diameter (diameter of a sphere with the same volume)
- Surface
- Shape:
- Sphericity
- Compactness
- Shape of fitted ellipsoid (from a Principal Component Analysis (PCA))
- Directional features:
- Projected length to a certain axis
- Projected area to a certain plane
- Orientation of fitted ellipsoid (PCA)
Face features
You can determine the following face features:
- General:
- Position
- Size:
- Face area
- Directional features:
- Surface normal direction
Statistics
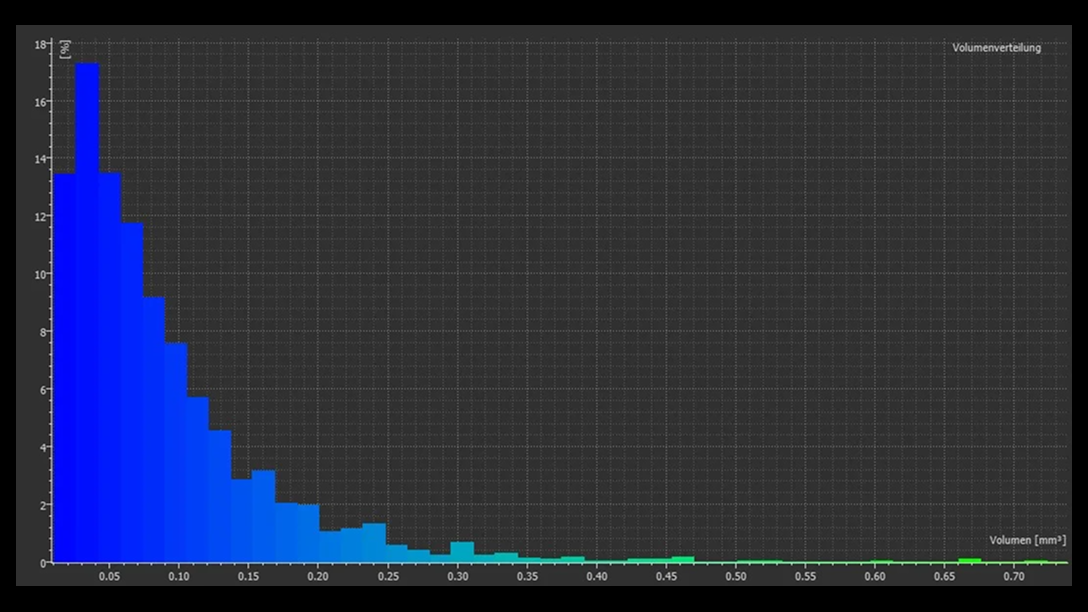
Histograms for cell features showing the distribution of cell volume
Histograms for cell features
Generate histograms for cell features either globally or in regions of interest.
Available features include:
- Cell volume
- Equivalent diameter
- Surface
- Average grey value
- Sphericity
- Compactness
- PCA deviations
- Projected area on a certain plane

Histograms for strut thickness
Histograms for strut thickness
Generate histograms for strut thickness. This allows you to determine the volume fraction of nodes and struts in foams or lattice structures.
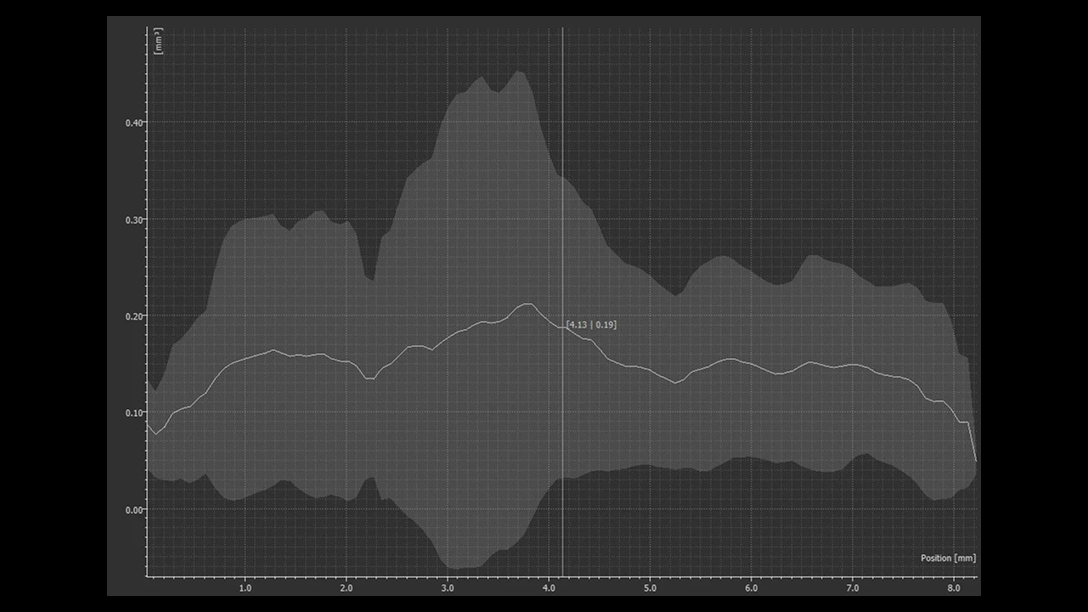
Directional variability
To investigate the directional dependency of the cell volume, among others, you can plot cell features over thickness in a certain direction using the directional variability plot. This is achieved by calculating the average of a cell feature over a layer and displaying this average (along with the minimum and maximum values) as a function of the layer's position.

Feature plot showing the compactness over volume for each individual cell
Feature plot
In addition to calculating and tolerancing parameters of individual cells, you can easily display dependencies between two parameters in a feature plot. For example, a plot of the the compactness against the volume for each individual cell may show that large cells are more spherical than small cells.
- Calculate cell sizes and strut thicknesses
- Characterise positions, sizes, shapes and orientations of all individual cells, faces, and struts in true 3D
- Use the same module for analysing foams and powders
- Handle large numbers of cells and condense the results in useful local and global statistics
- There is no need to separate cells manually
- Perform analyses easily—no programming required
- Visualise cell features in 3D to provide an easy-to-understand representation of the data
Powder analysis
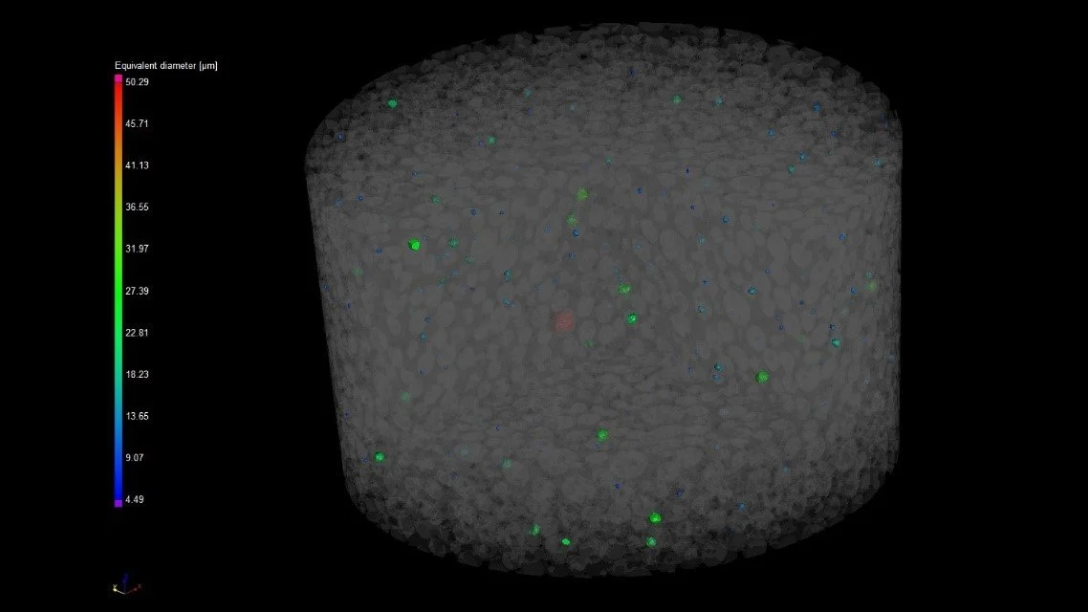
The powder analysis features allow you to measure the form and size of powder particles individually or in specified groups or the complete powder sample and generate insightful statistics. Separate grains within powder or other granular materials to quantify them individually and determine important parameters, such as particle size, volume, surface area, compactness, and distributions of these parameters, as well as the cleanliness of the powder feedstock.

CT scan of metal powder with colour coding for powder grain equivalent diameter
Powder analysis features
With the powder analysis, you can:
- Measure volume, equivalent diameter, and sphericity for every single powder grain and complete powder sample
- Generate comprehensive statistics and reports
- Create 3D visualizations of the complete CT volume and single grains
- Create virtual 2D cross-sections similar to microscopic 2D powder characterisation
- Export 2D cross-sections for further analyses
- Detect inclusions and other impurities*
*Porosity/Inclusion Analysis module required
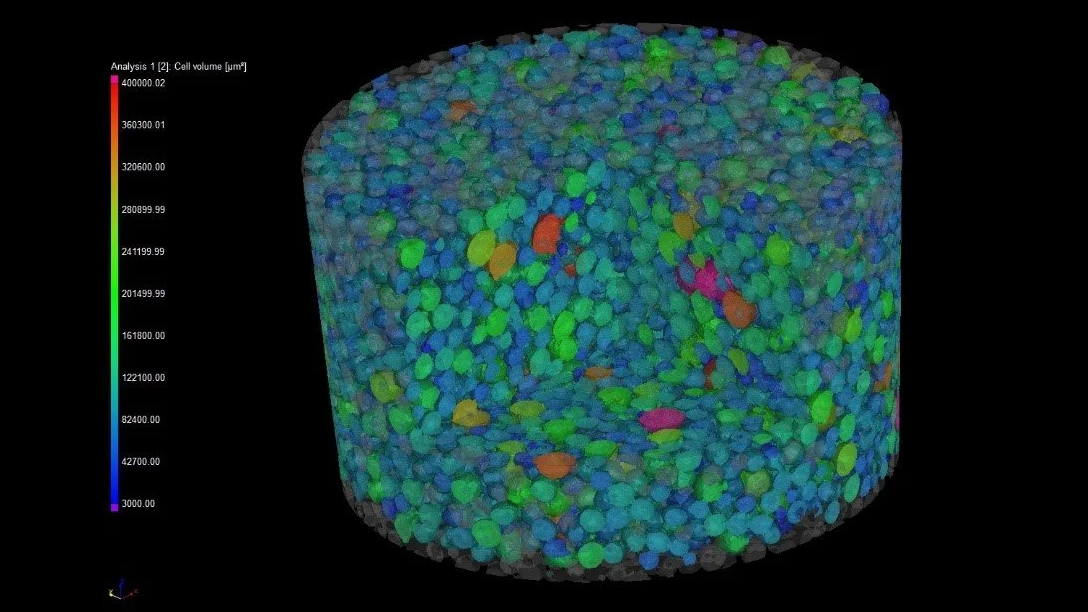
3D visualisation of volume
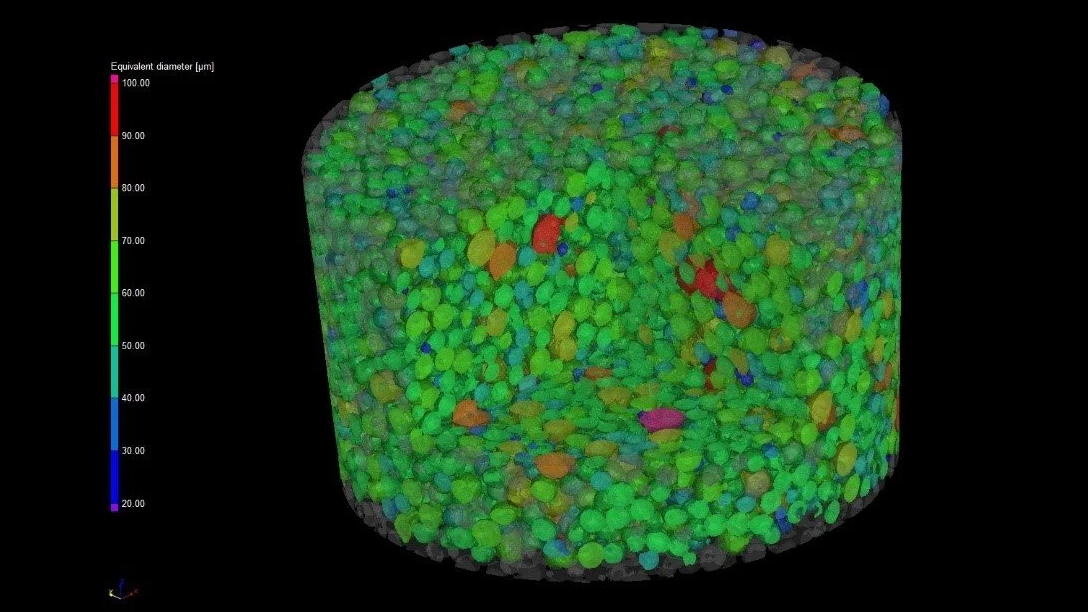
3D visualisation of equivalent diameter
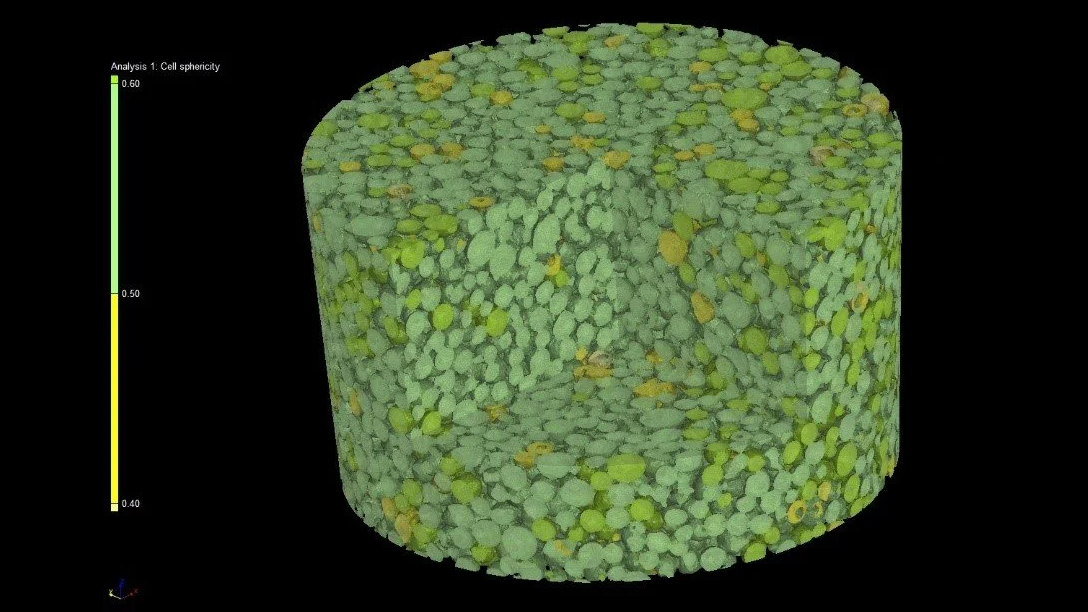
3D visualisation of sphericity
Parameters for individual grains
You can determine the following parameters for single grains using the powder analysis:
- Position
- Volume
- Equivalent diameter (diameter of a sphere that has the same volume)
- Surface
- Mean grey value
- Sphericity
- Compactness
Complete powder sample
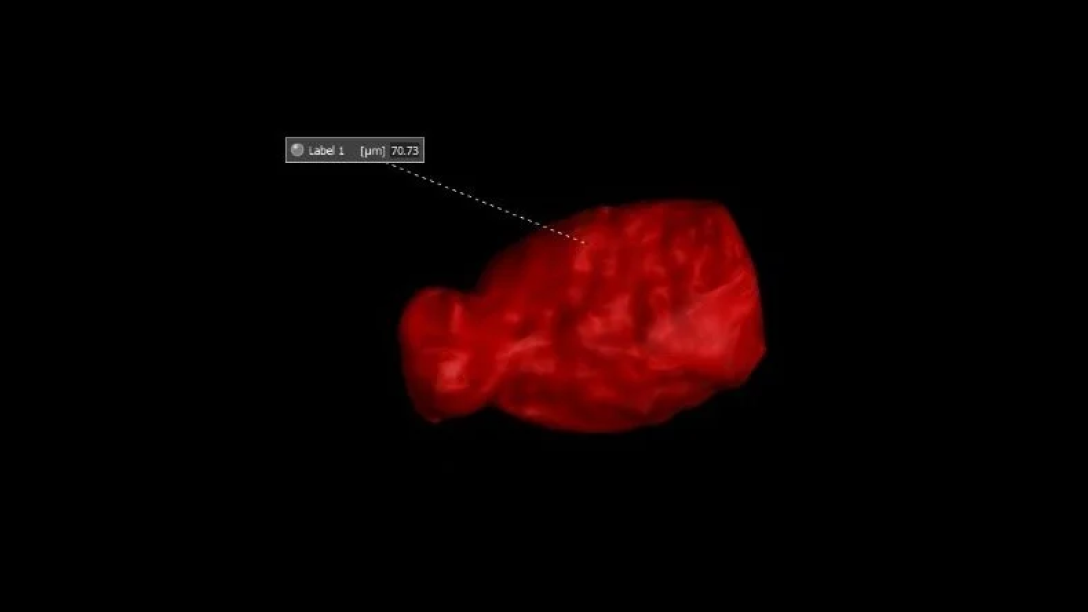
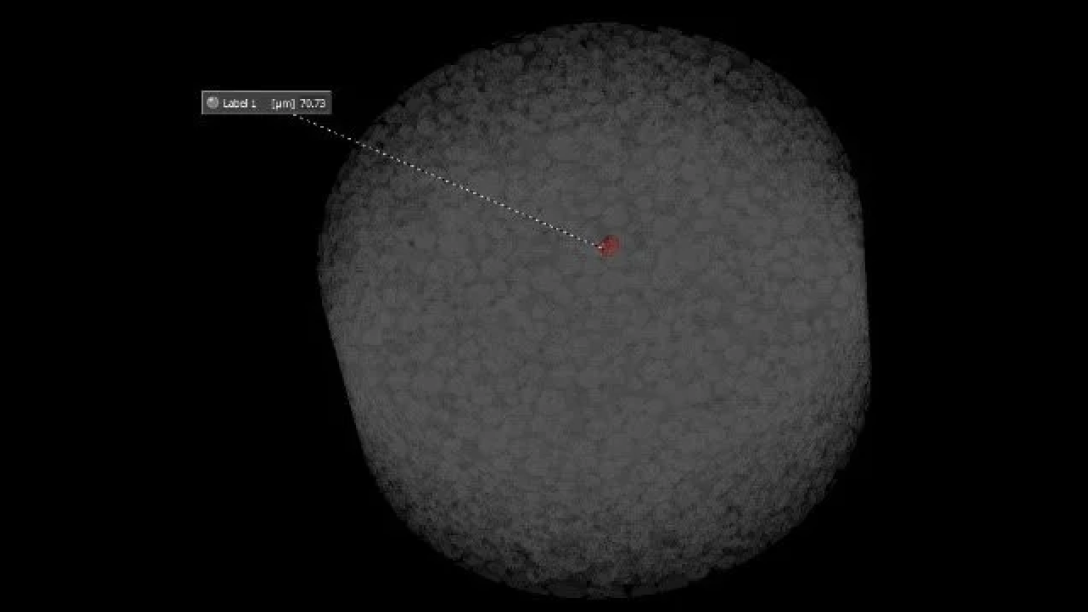
Single grain
From the complete powder sample to a single grain
With a powder analysis, you can create 3D visualisations of the complete powder sample as well as of a single grain.
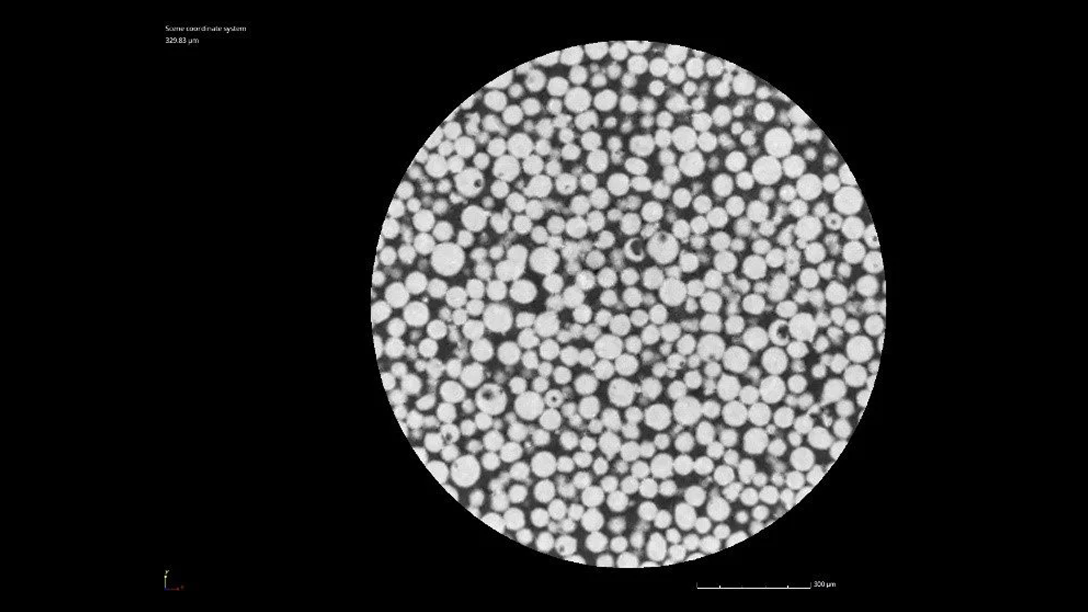
Virtual 2D cross-section for a powder
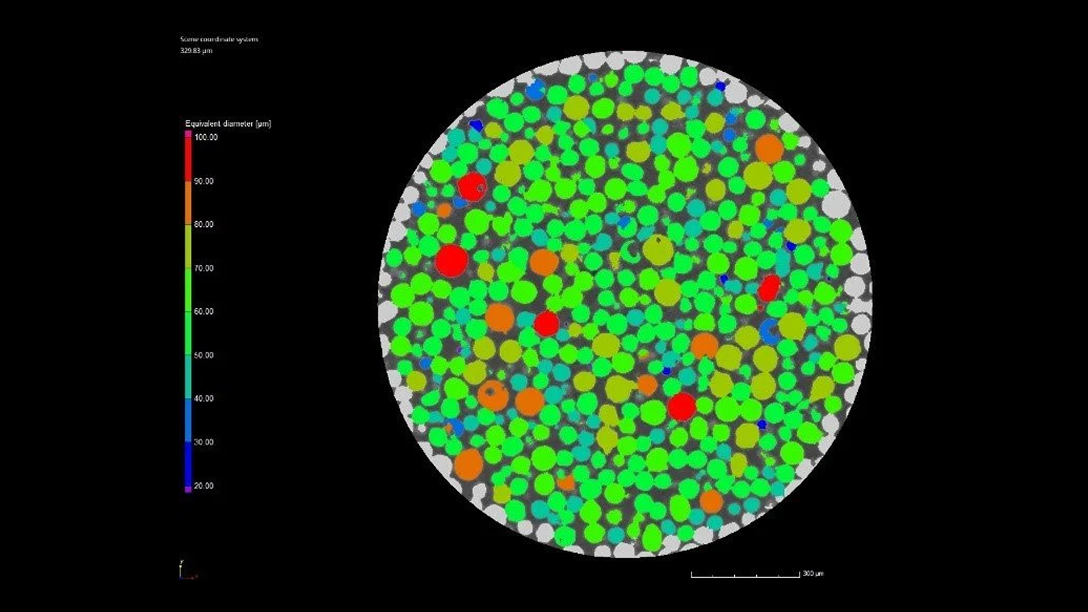
Virtual 2D cross-section, colour coded by equivalent diameter
Virtual 2D cross-sections
Create virtual 2D cross-sections similar to a microscopic 2D powder characterisation. For further analyses, you can export these 2D cross-sections.
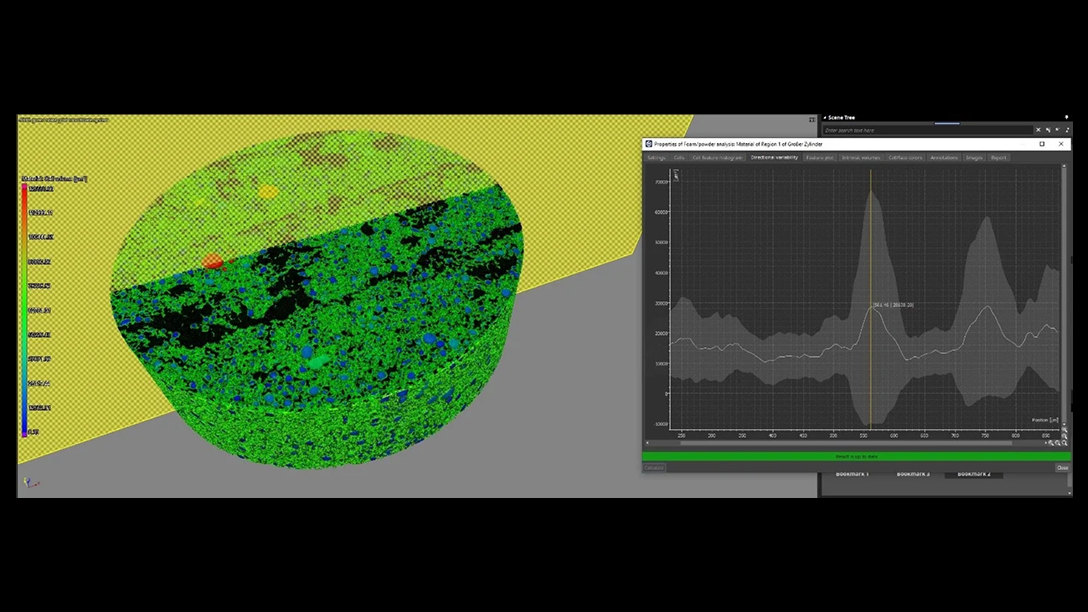
Directional variability along the y-axis through metal binder jetting green part, which shows irregular powder size distribution throughout the part (images courtesy of Fraunhofer IFAM)
Directional variability
Plot powder features in a certain direction to investigate, among others, parts manufactured by binder jetting. In this case, the process-induced distribution of powder in the green part.
3D visualisation of powder volume with detected porosity inside powder grains
Detection of inclusion and other impurities
With the additional Porosity/Inclusion Analysis module, you can also detect porosity within powder grains and impurities in the powder sample, such as inclusions of foreign material.
Statistics
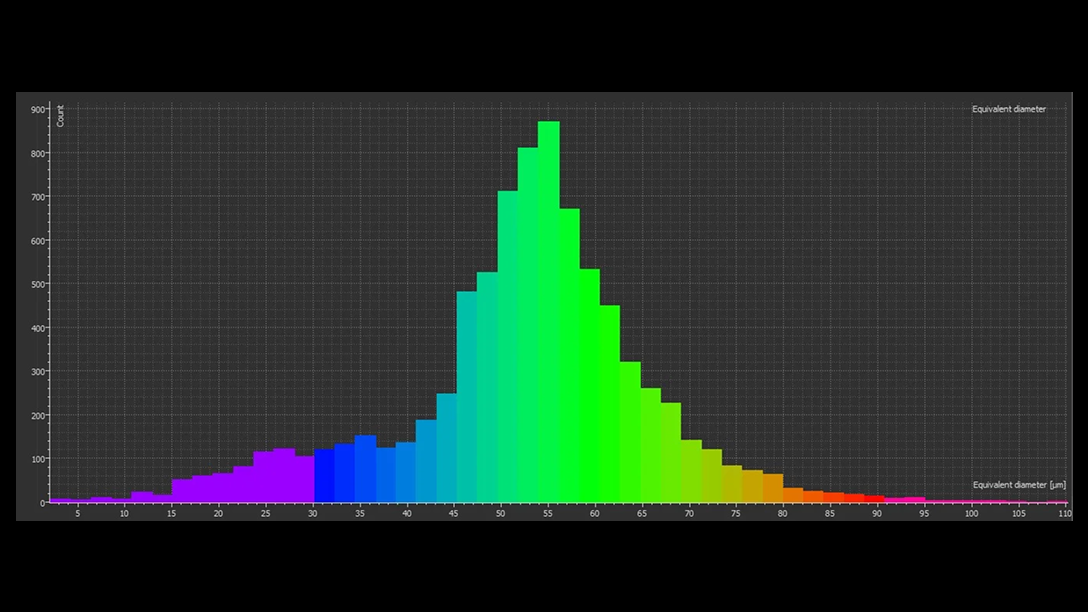
Histogram of equivalent diameters
Histograms
The distribution of the values of a corresponding grain parameter can be displayed using histograms. In the following example, which is a CT scan of a Ti6Al4V powder sample, the distribution of the equivalent diameters of the powder grains can be seen.

Feature plot of sphericity (X axis) to equivalent diameter (Y axis)
Feature Plot
Via the X-Y-Plot, you can easily visualise dependencies between grain parameters. For example, the dependency between sphericity and equivalent diameter can help you understand progressive powder aging and evolving powder satellite formation.
Access complete statistics, histograms, and feature plots on all measured grain parameters.
Rely on accurate 3D characterisation of morphology and size for every powder grain without having to physically isolate the grains.
Analysis can be automated to ensure consistent results and reporting of analyses taken over time

Contact us today—our team is ready to assist!
Request a quote