
Porosity/Inclusion Analysis features
Locate pores, holes, and inclusions within parts and get detailed information on these discontinuities:
- Detect, characterise, and visualise porosity in 2D and 3D using computed tomography
- Distinguish between gas pores, shrinkage cavities, cracks, and inclusions of foreign material
- Take wall thickness analyses and subsequent machining steps into account
- Automatically quantify the surface size of discontinuities in 2D CT slice images in accordance to BDG Reference Sheet P 201/P 202
- Perform a 3D evaluation with regard to the most critical porosity parameters within functional areas of the part in accordance with BDG Reference Sheet P 203
- Get results for later use in subsequent simulations
- Use data in statistical evaluation software such as Q-DAS qs-STAT
Global porosity parameters
Determine these global porosity parameters for the entire component:
- Total pore volume
- Total material volume
- Total porosity
- Total surface of the pores
- Projected total area of all pores in any spatial direction
Sphericity (Source: BDG – P 203 / www.bdguss.de)
Distance to next pore (Source: BDG – P 203 / www.bdguss.de)
Properties of individual pores
Determine these parameters for individual pores:
- General:
- Position
- Deviation of grey values
- Minimum, maximum, and average grey value
- Size:
- Volume
- Surface
- Equivalent diameter (diameter of a sphere with the same volume)
- Radius or diameter
- Shape:
- Compactness
- Sphericity
- Shape of fitted ellipsoid (from a Principal Components Analysis)
- Projected dimensions:
- Projected length in arbitrary spatial directions
- Projected area in arbitrary spatial directions
- Additional features:
- Classification (inside, outside, or cut from the machined surface)
- Minimum and maximum edge distance
- Cut surface with component surface
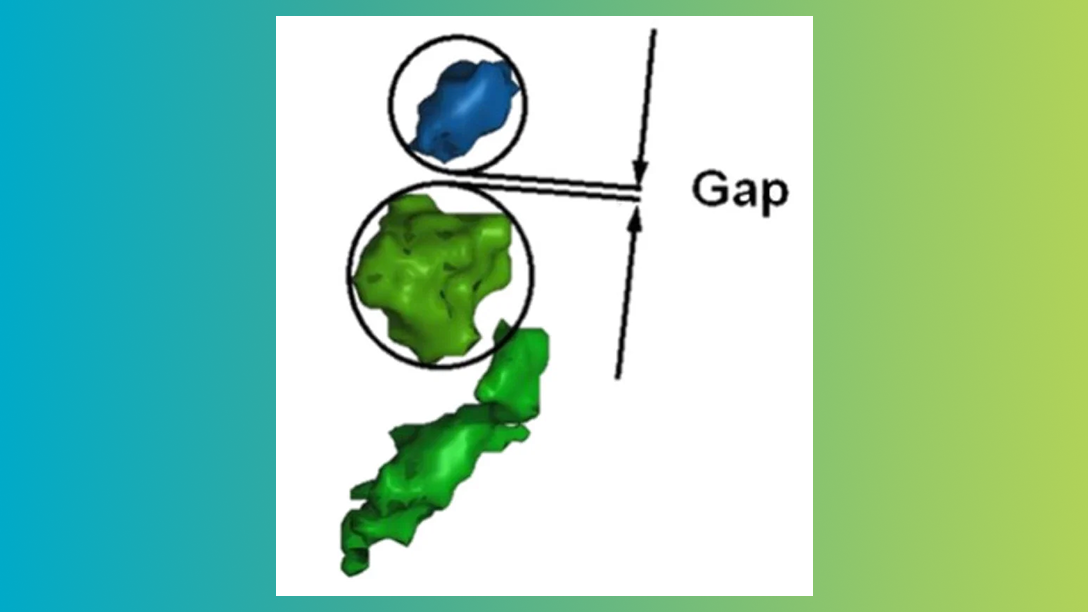
- Distance to next pore (gap)
- Wall thickness at the location of the pore
- Relative diameter (i.e., diameter of the pore relative to the local wall thickness)
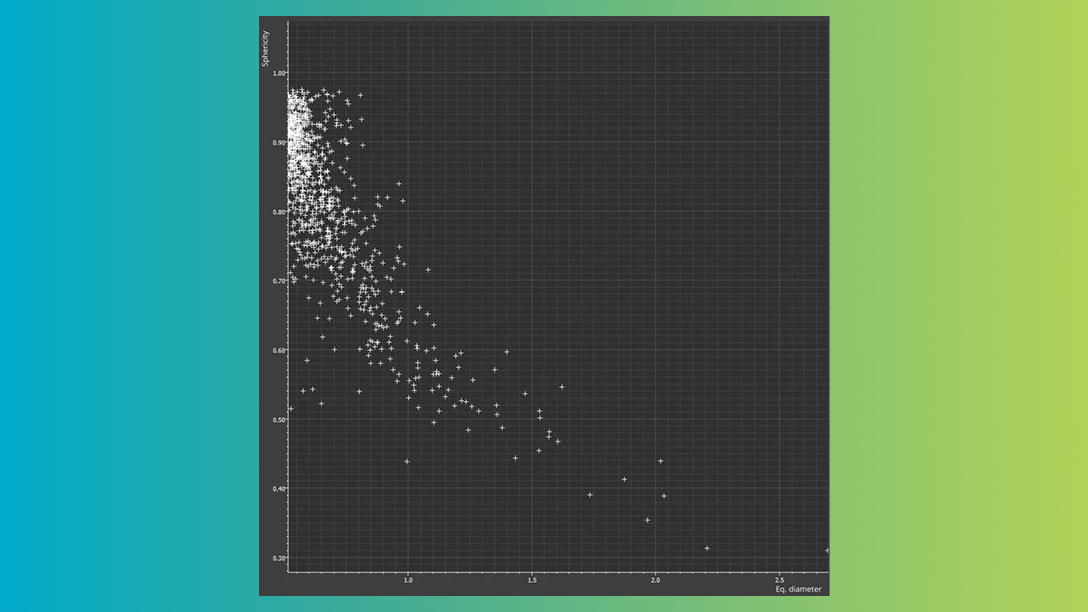
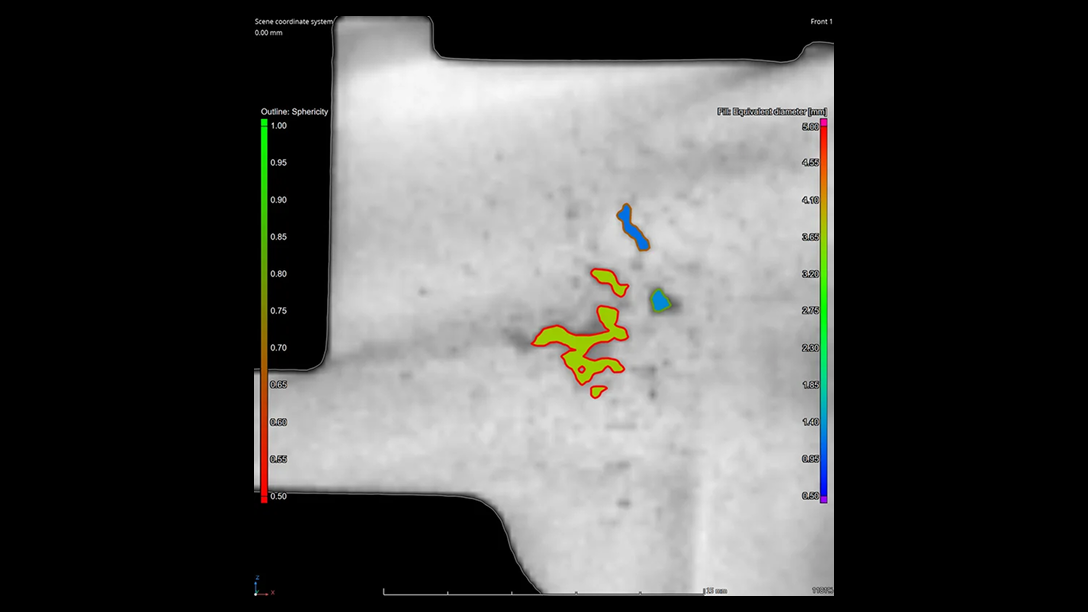
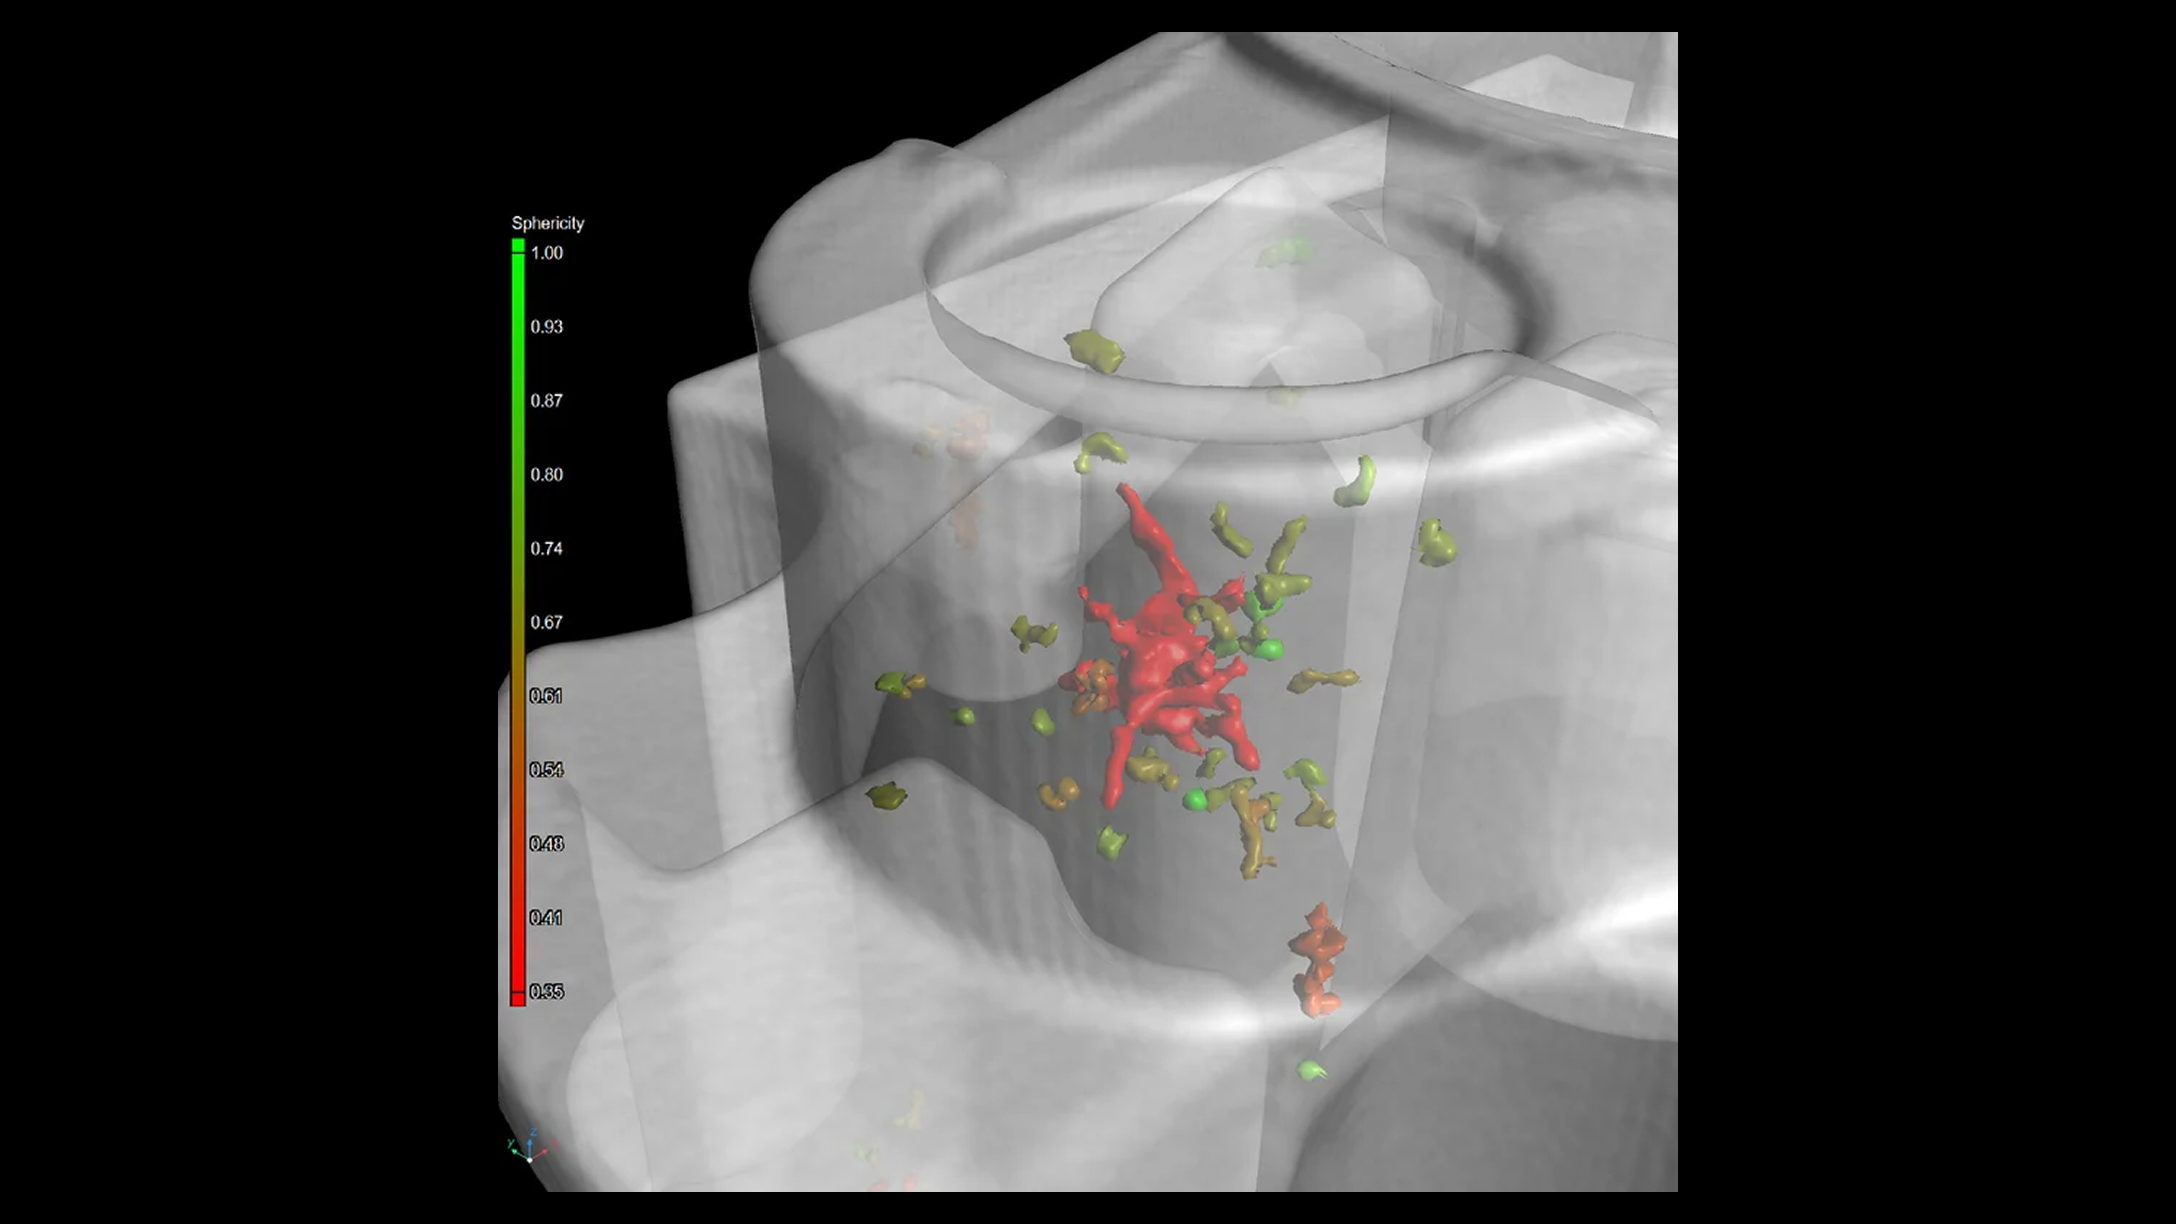
Sphericity plotted against equivalent diameter
Dependencies between porosity parameters
In addition to the calculation and tolerancing of porosity parameters, you can easily display dependencies between porosity variables using suitable graphical representation in y-x plots. For example, a plot of the sphericity against the equivalent diameter may show that the larger pores are shrinkage holes, which can be identified by their lower sphericity.
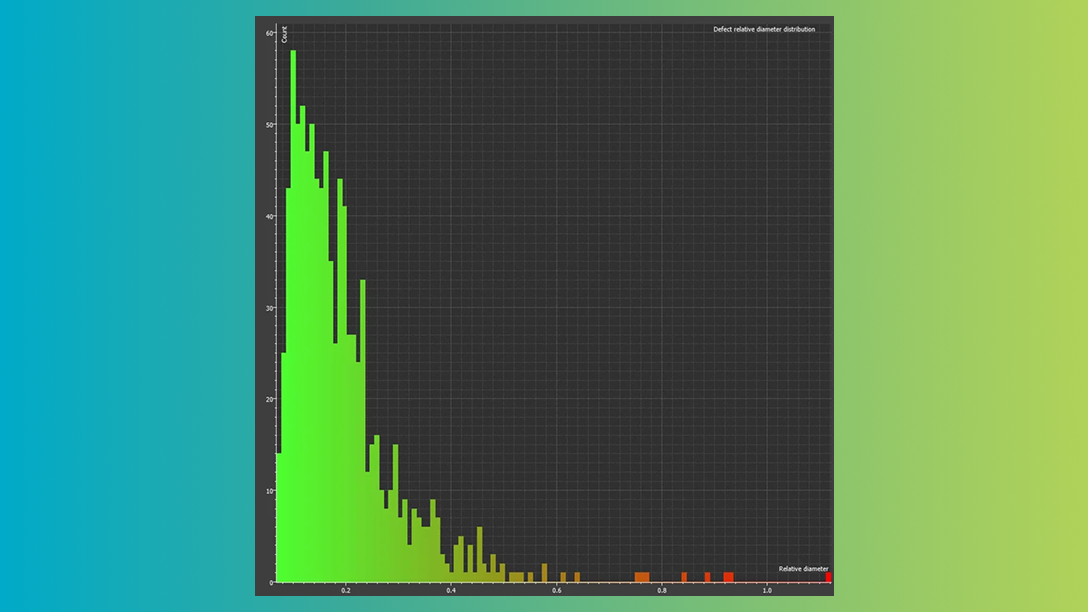
Histogram for relative diameter
Histograms
The distribution of the values of a corresponding parameter can be displayed using histograms. This example shows that the majority of discontinuities are characterised by a small relative diameter. Those with a relative diameter close to one will be considered critical, since the spatial extent and the minimum wall thickness in the area of the pore are in the same order of magnitude.
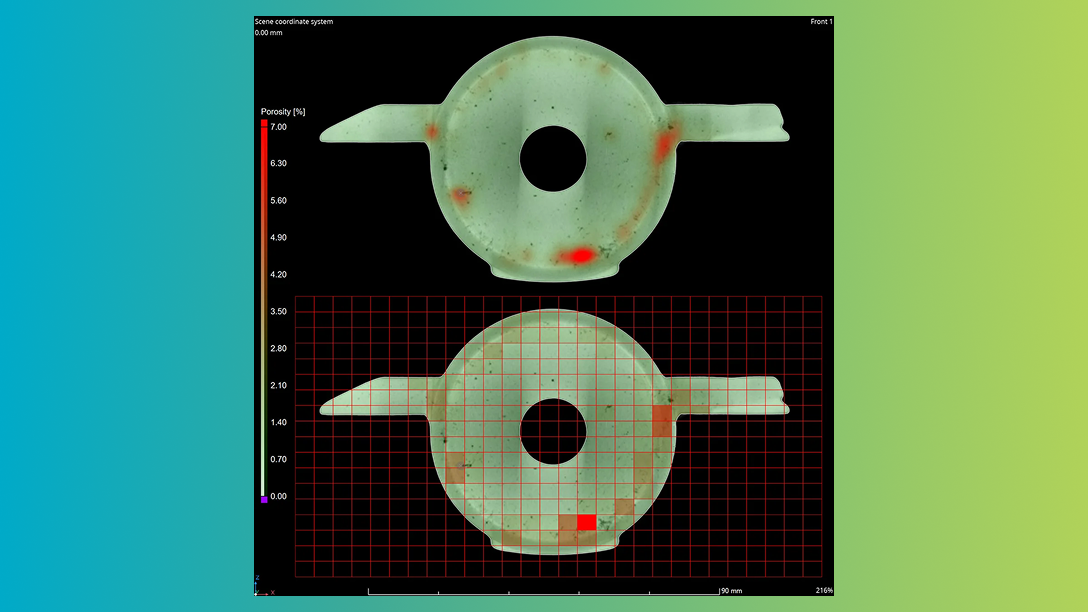
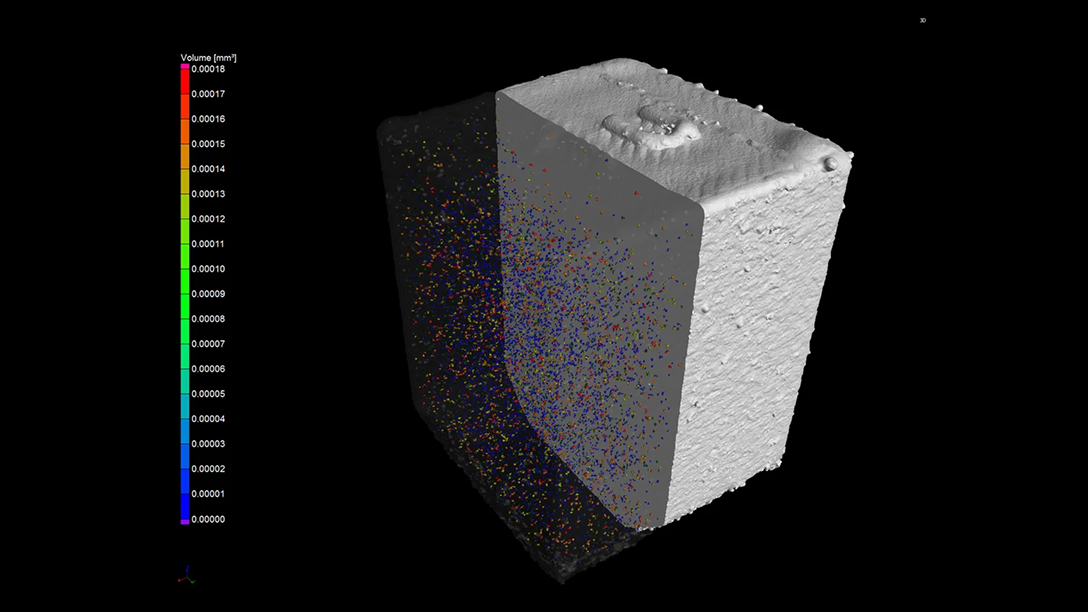
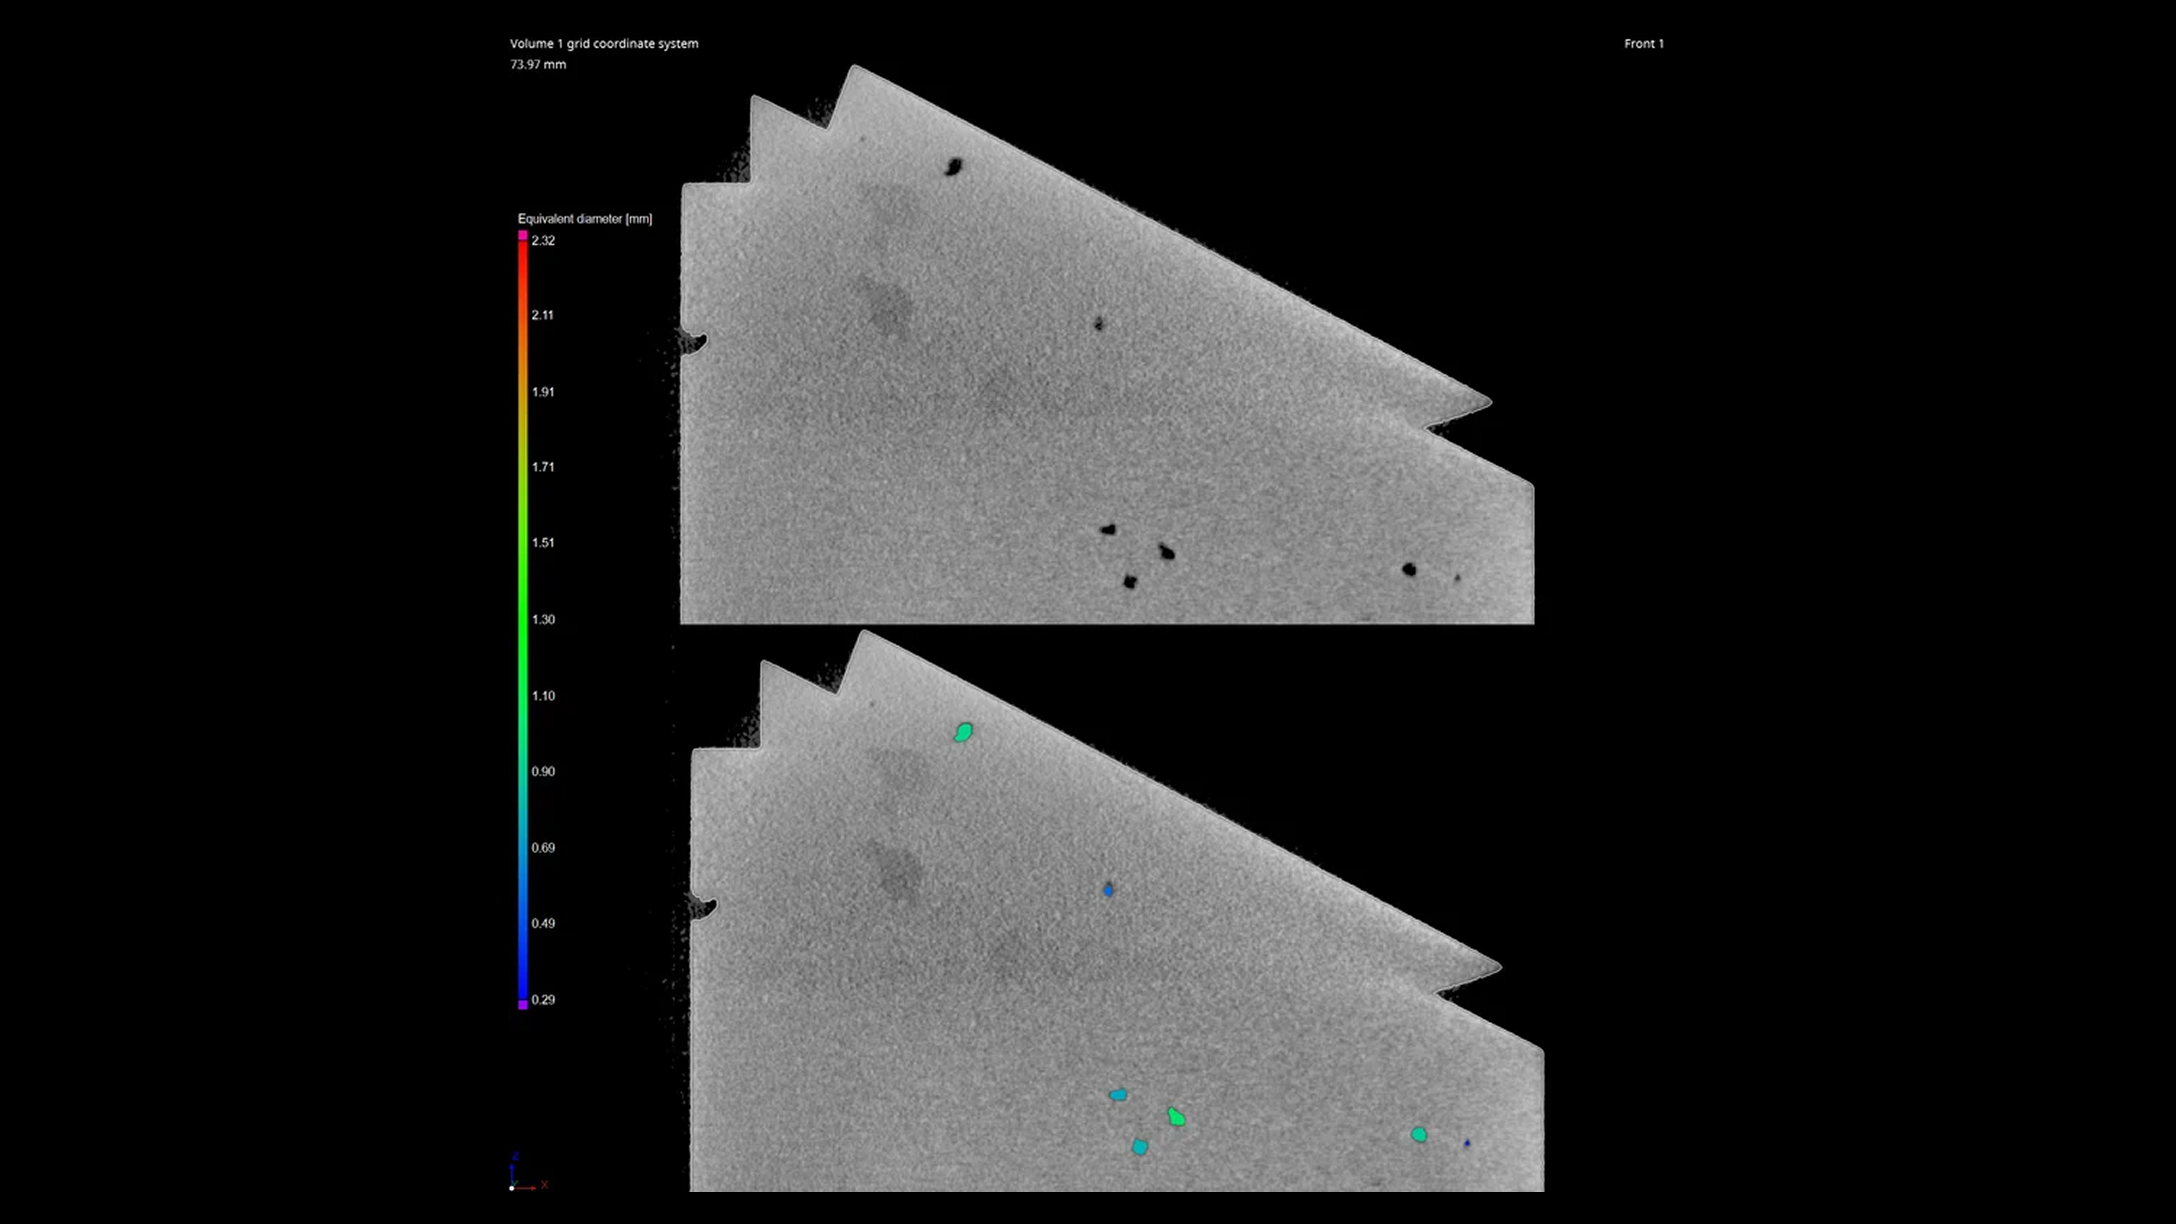
Local porosity (top) and local porosity in a volume mesh (bottom)
Local porosity calculation
Since single discontinuities aren't the only things crucial for component stability, our software also offers the opportunity to investigate porosity accumulations and their effects in more detail.
Besides calculating local porosity and local concentrations, it is also possible to map porosity in cells of volume meshes. Regular meshes can also be used, as well as volume meshes adapted to the CAD or the actual surface.
Practically relevant results
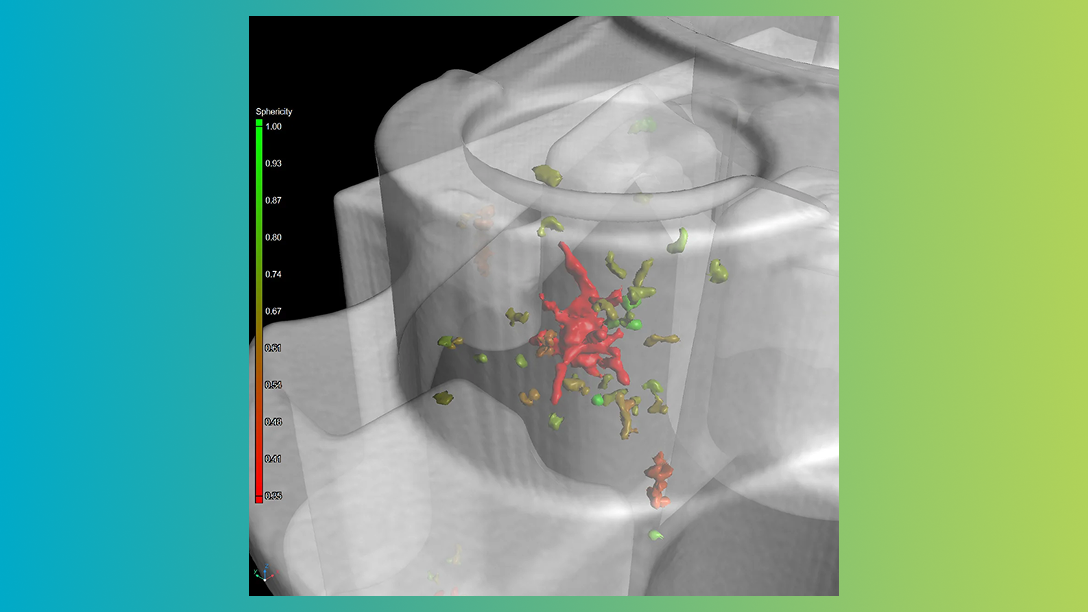
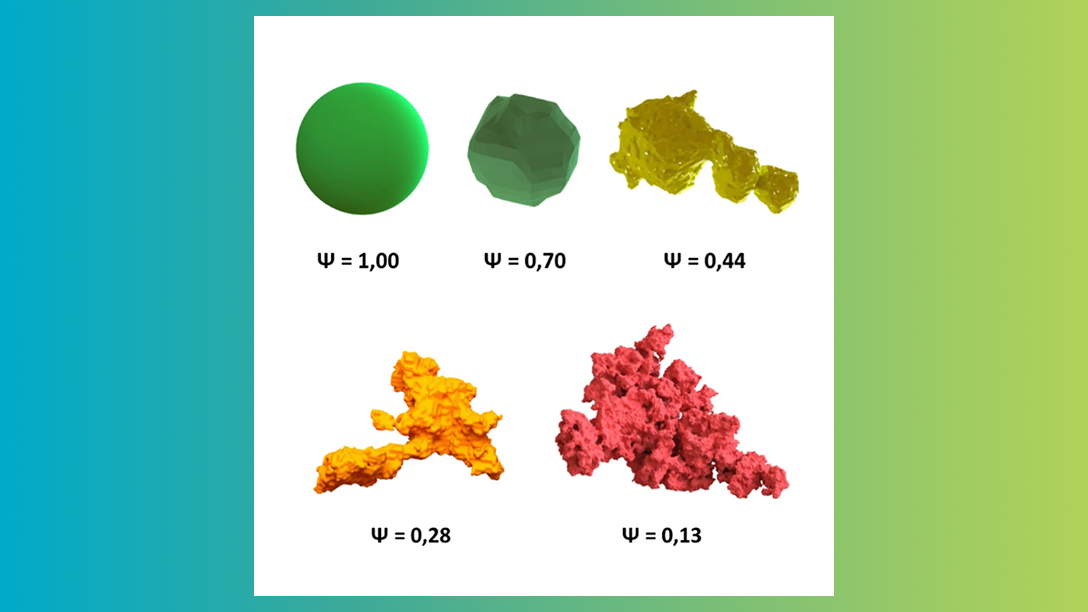
Sphericity
Examples of relevant porosity parameters
The results for certain porosity parameters allow you to draw conclusions such as:
- Total porosity: Fluctuations in the production process can be detected easily by monitoring the total porosity over a longer period of time. An increase in this value may indicate unsuitable casting speeds or insufficient venting of the mould cavity.
- Sphericity: The sphericity value, which is calculated from the pore volume and the pore surface area, allows you to distinguish between gas pores (which are characterised by higher sphericity values) and shrinkage holes (which have lower sphericity values). Knowledge about the shape of discontinuities supports process optimisation and also provides information about the durability of the component.
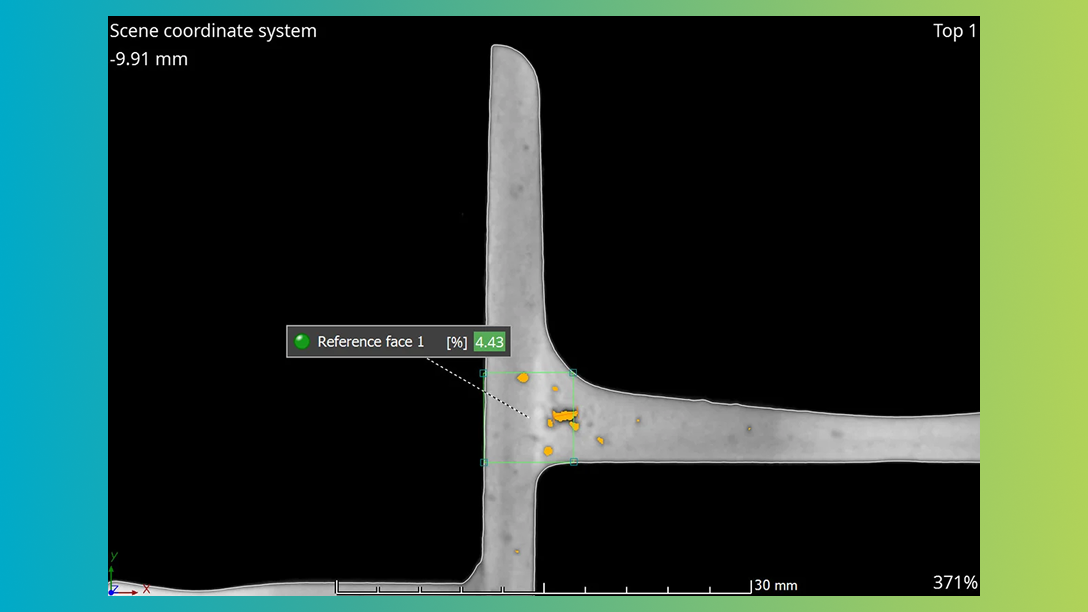
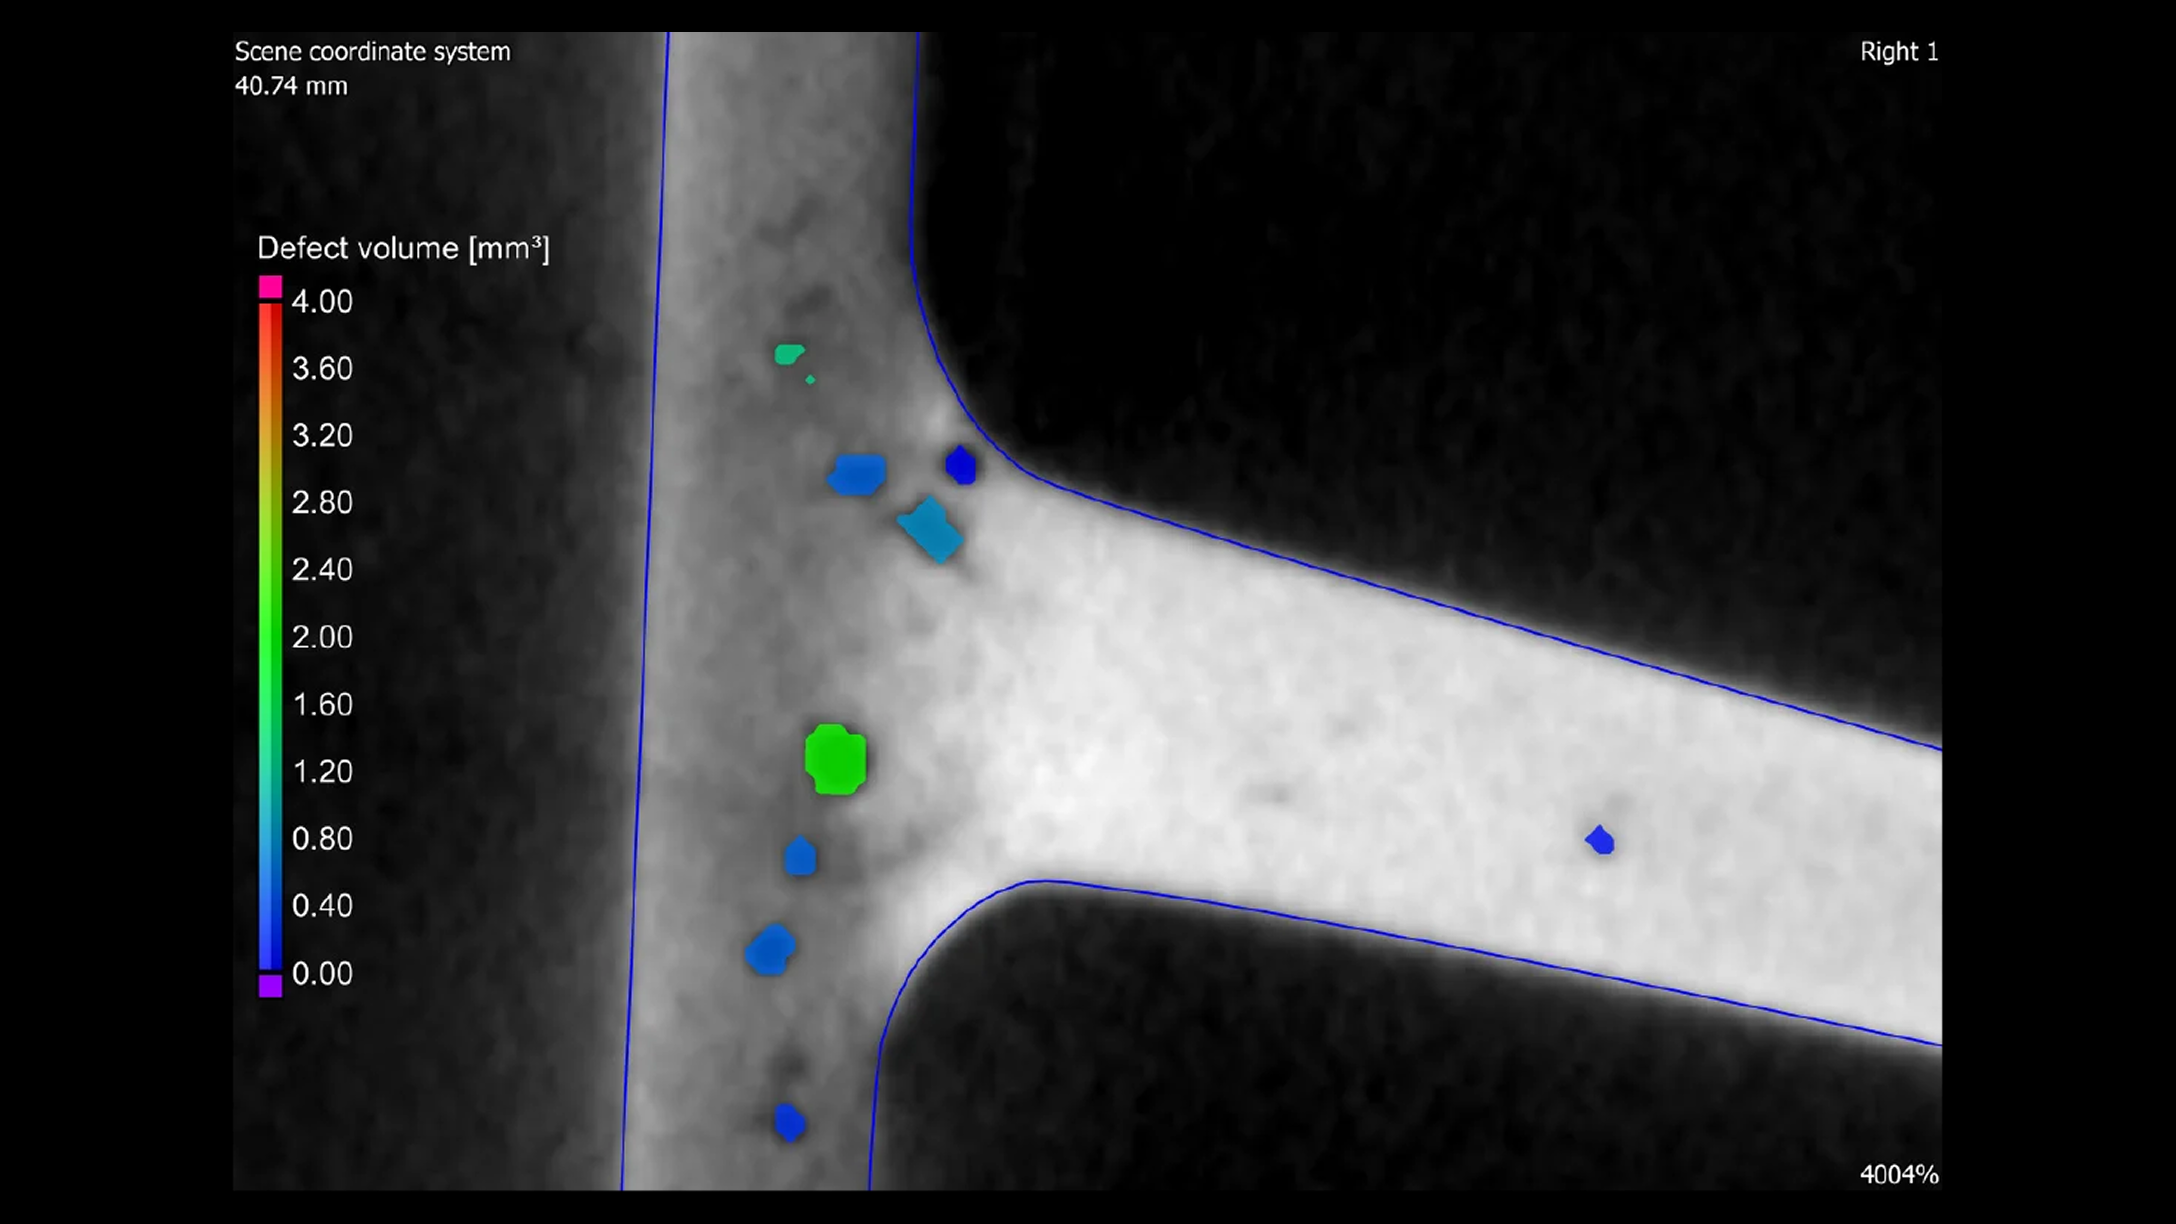
- Distance to surface: By calculating the distance to any surface, you can verify the suitability of sealing and thread surfaces before machining. The porosity analysis simulates the surface to be processed. The depth of the remaining porosity in the machined area can be calculated and visualised. This is, for example, important for sealing surfaces since air inclusions in open pores can displace the sealing material under thermal stress.
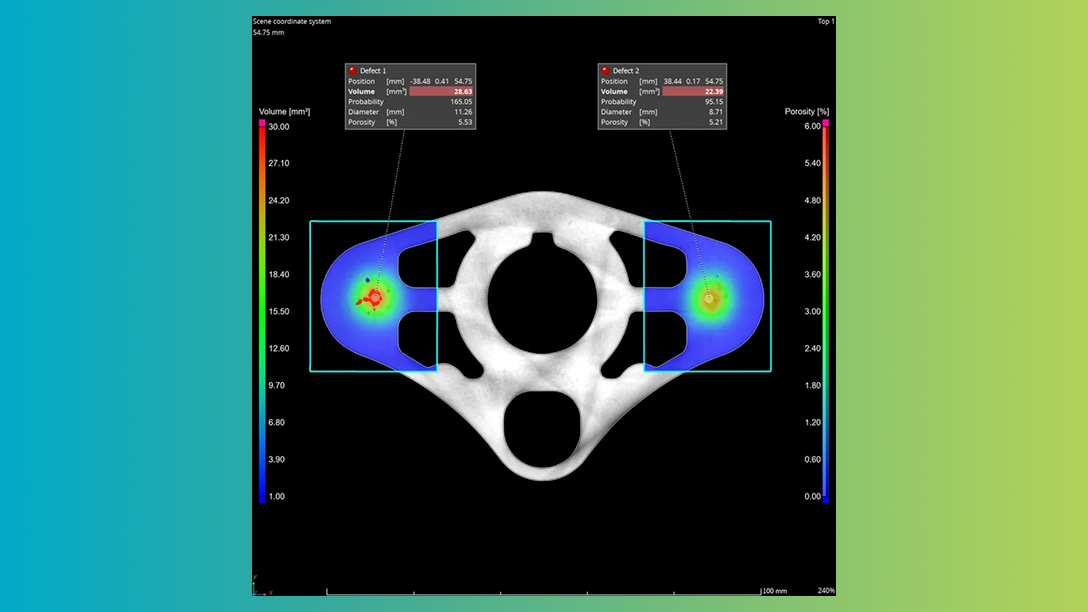
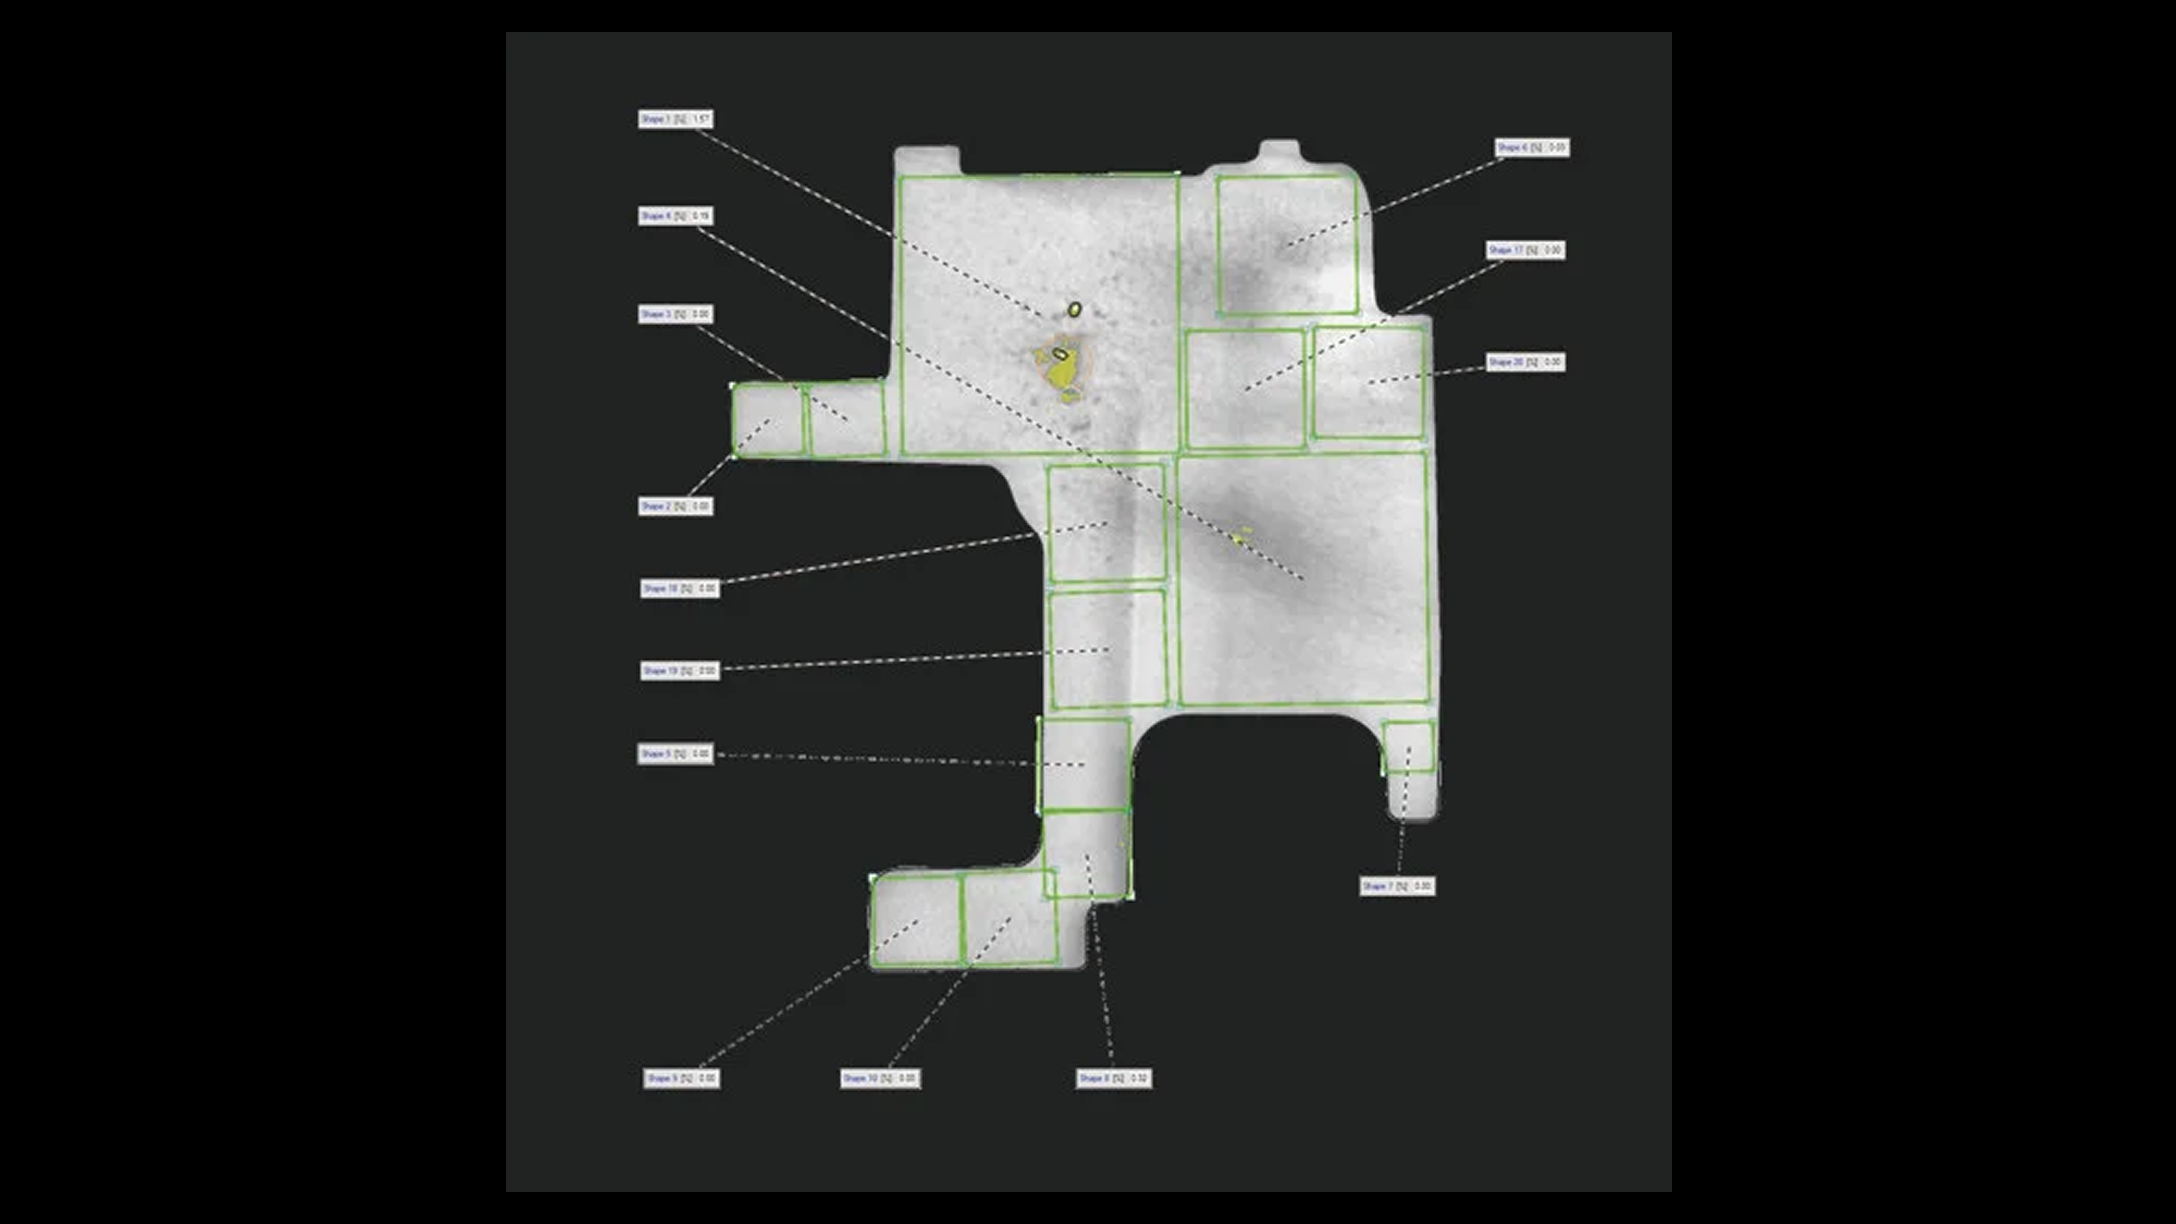
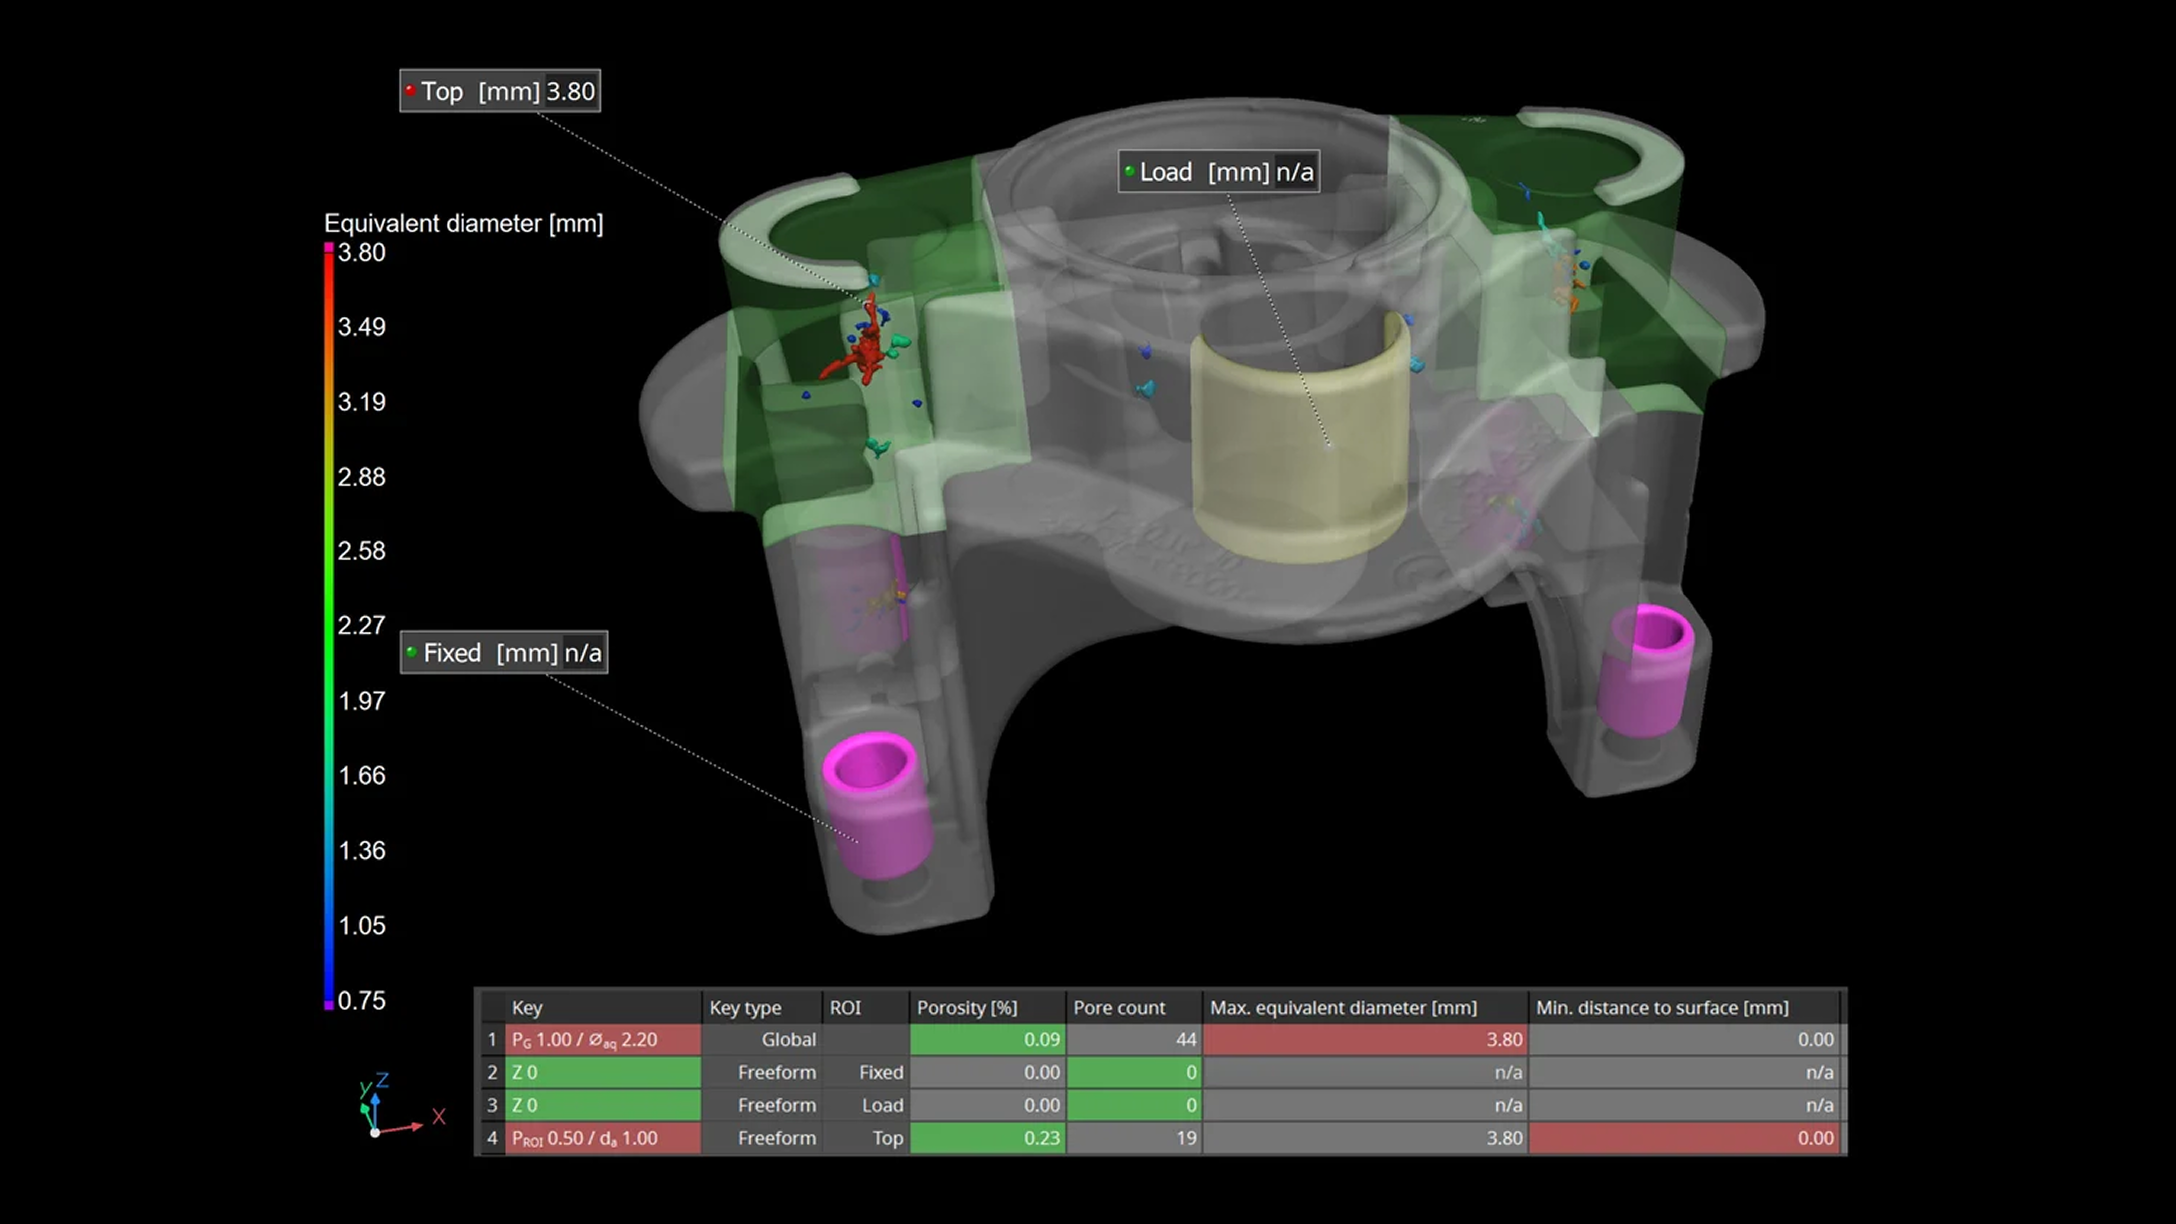
Porosity analyses can be applied to user-defined Regions of Interest (ROIs) of the part with tolerancing criteria specific to the region
Focus on functional areas
Limit analyses to relevant areas:
- Regions of interest (ROIs): You can apply porosity analyses to specific regions of the part using different filter and tolerance settings. For example, the porosity analysis can be limited to the area of the casting skin if the goal is to examine gas pores near the casting skin surface.
- Discontinuities can be linked with wall thicknesses.
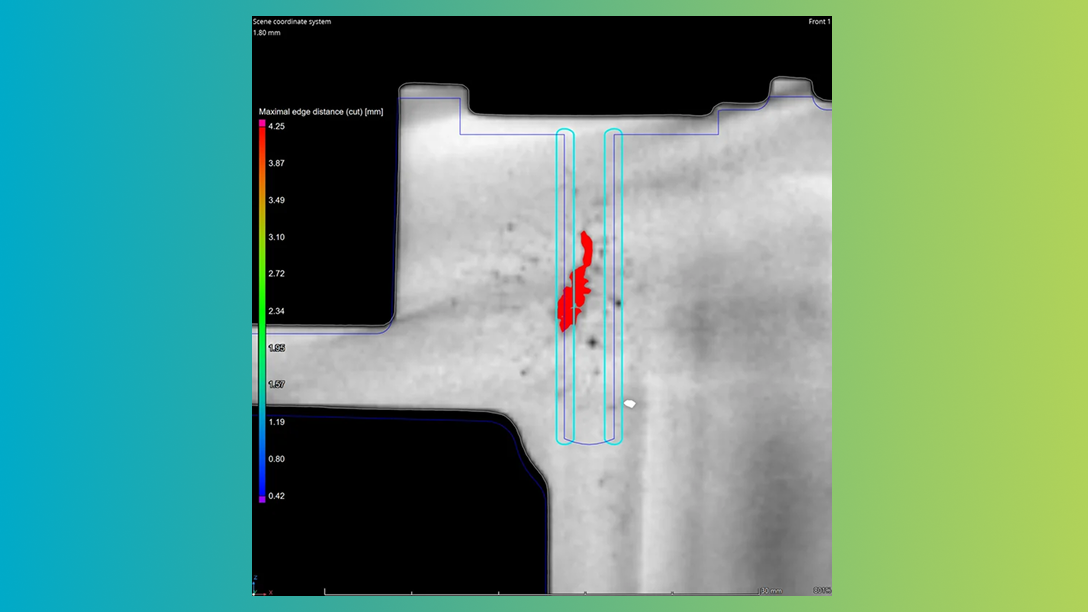
Machining tolerances can be included in the analysis as a parameter for the absolute distance to surface
Virtual processing
Shows whether and how pores would be cut during machining:
- Pore position and size can be calculated not only in relation to the current component surface but also to any other surface.
- Thus, you can include subsequent machining of the part (for example, drilling) in a porosity analysis and determine the distances of the pores to a machined surface. In particular, you can check whether pores would be cut, rendering the machined surface useless. This way, you can sort out a part before cost-intensive machining.
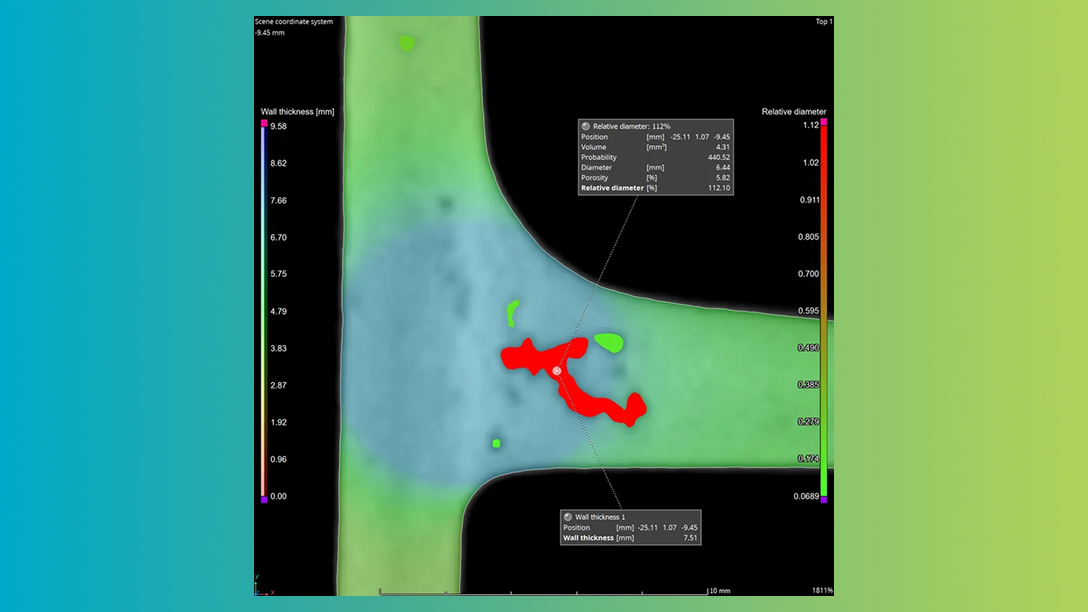
Discontinuities can be linked with wall thicknesses
Logical combination of multiple tolerancing criteria
Perform tolerancing with decision trees:
- Automate casting inspection by defining the tolerances for individual porosity parameters for functionally relevant areas (special attributes)—e.g., number, size, and position of individual pores—while defining the tolerances for the entire casting as global porosity parameters (for example, maximum total porosity in %).
- Map more complex issues by combining tolerance statuses of individual analyses, which is especially useful in automated inline scenarios. For example, a casting can be classified as "not okay" if a certain porosity has been exceeded and there is a huge amount of porosity in the region of the cast skin. If none of the parameters are exceeded, the part is marked as "okay."
Conforming to standards
The Porosity/Inclusion Analysis module supports three of the most important guidelines for porosity analysis, enabling easy and reproducible evaluations of cast parts: BDG Reference Sheets P 201, P 202, and P 203.
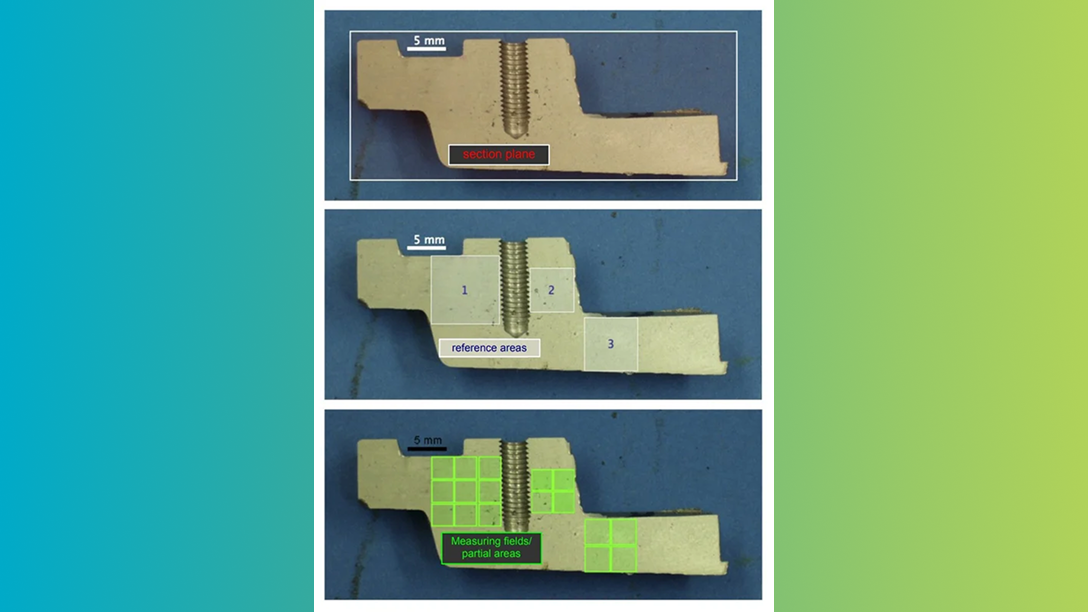
Application examples for reference areas: section plane of a casting with reference areas and measuring fields/partial areas for quantitative porosity evaluation. (Source: BDG – P 202 / www.bdguss.de)
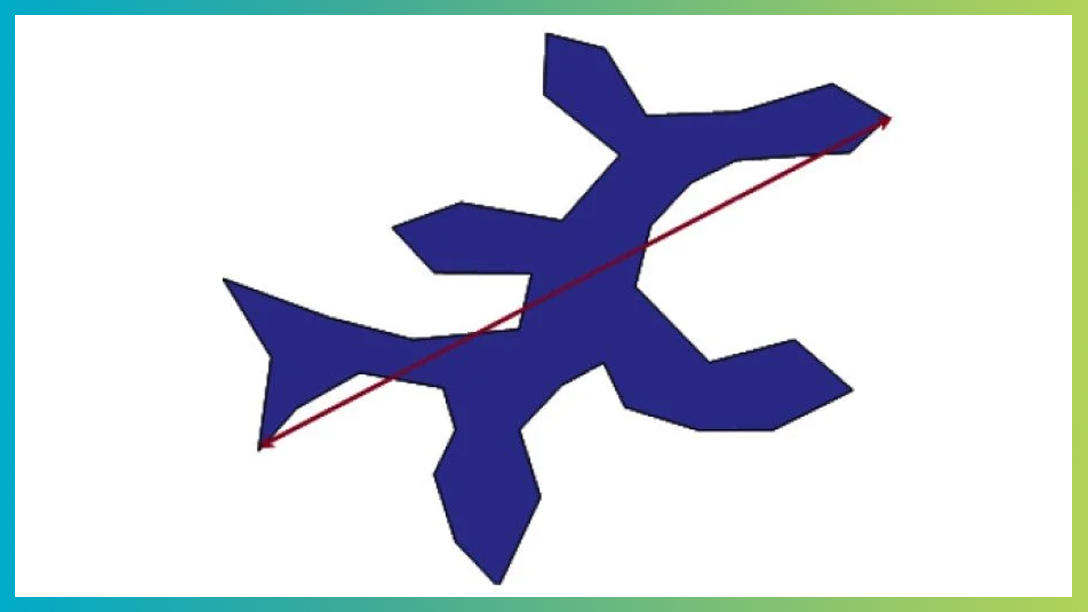
Pore length (= maximum Ferret) or analogy diameter [ØL] (Source: BDG – P 202 / www.bdguss.de)
P 202 Analysis
P 201 and P 202
To classify porosity parameters in slice images, VDG Specification P 201 (VW 50097) as well as BDG Reference Sheet P 202 (VW 50093) is used. These analyses provide a digital, fully non-destructive take on the classic micrograph analysis, which was achieved by sawing open the component.
With the analyses according to VDG - P 201 and BDG - P 202, you can tolerance the following parameters in arbitrarily oriented digital component sections by means of a porosity key:
- Maximum surface porosity
- Maximum pore diamenter (equal area of circle [ØF])
- Maximum length of pores ("Ferret"; compared diameter [ØL])
- Minimum normalized distance between adjacent pores
- Maximum number of pores
The evaluation is performed both in the entire section and in reference areas (square, rectangle, triangle, circle) set by the user.
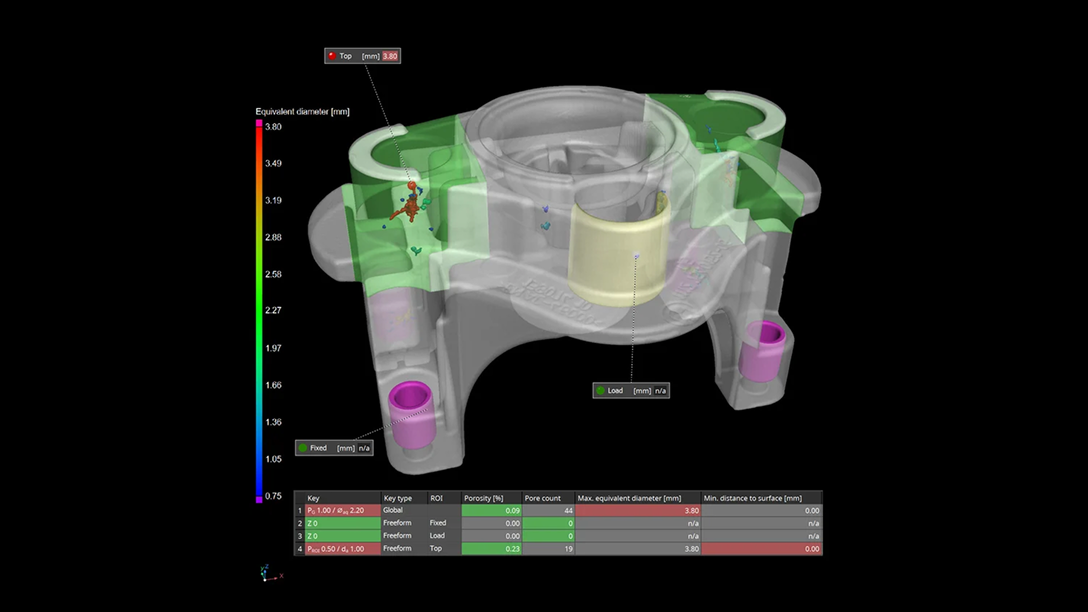
VG software integrates important specifications according to BDG Reference Sheet P 203
We support the definition of the volume for the pore assessment and three-dimensional characteristics of internal volume deficits according to BDG - P 203
P 203
The BDG Reference Sheet P 203 not only extends VDG - P 201 and BDG - P 202 to 3D but also puts an additional focus on the specific assessment of functionally relevant part areas by using free-form regions.
VG software integrates the necessary specifications according to the BDG Reference Sheet P 203 for defining the volume for pore assessment, as well as for defining the three-dimensional characteristics of internal volume deficits. Intuitive input functions make it easy to define porosity specifications based on the porosity key, according to BDG - P 203.
VG software supports the fully automatic determination of the so-called "Q factor" as proposed by the BDG Reference Sheet P 203. The Q factor is a simple, user-independent approach for verifying the quality of the grey value volume and documenting the quality of your CT scan data directly in the P 203 analysis.
Our software also enables you to perform porosity analysis according to BDG-P 203 on raw parts with additional reference surfaces, such as a 3D CAD-machined part. This allows you to evaluate the porosity of the to-be-machined surfaces in advance.
You can automatically display the corresponding BDG P 203 porosity key and the analysis results for each analysed free-form partial volume (ROI) in the 3D window and the 2D windows. This simplifies the evaluation of the porosity analysis as well as the orientation in the examined data set. Quick OK/NOK ("not okay") decisions can be made and documented.
You will also receive the number of NOK pores for selected porosity parameters that are out of tolerance within the global volume and within a free-form partial volume (ROI). This allows you to differentiate between outliers and a systematic production problem, which leads to better process control.
Furthermore, the porosity key, according to BDG - P 203, can also be used to exclude discontinuities from the evaluation due to their porosity parameters, such as gas pores and micro-cavities with a maximum diameter of, for example, 0.6 mm.
Workflows and interfaces
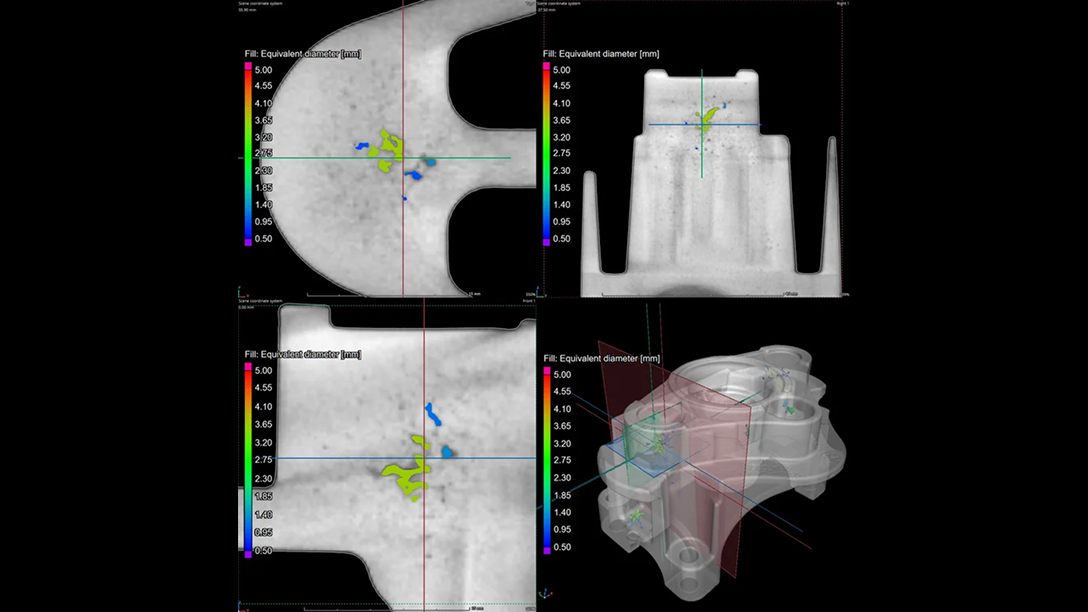
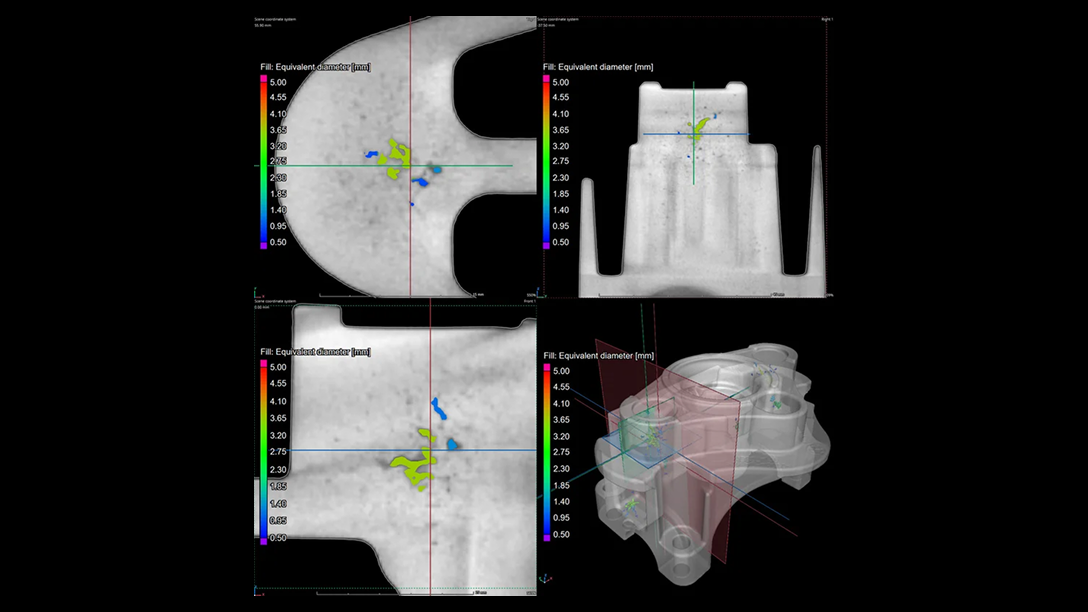
Discontinuities can be coloured according to a selected parameter
Easy visualisation
Unlock the real value of your results with the comprehensive yet easy-to-use visualisation features.
Navigation in individual parts and series of parts:
- Discontinuities can be coloured according to a selected parameter
- Discontinuities are displayed in a combination of 2D and 3D views
- Analysis markers can be created manually and automatically
- A series of parts can be reviewed in VGinLINE APPROVER
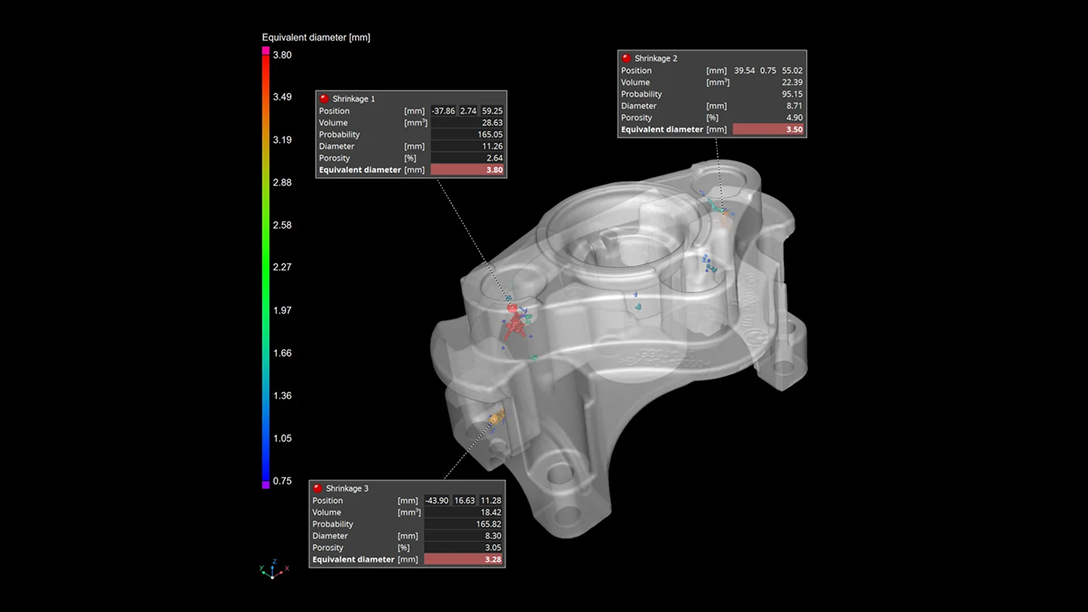
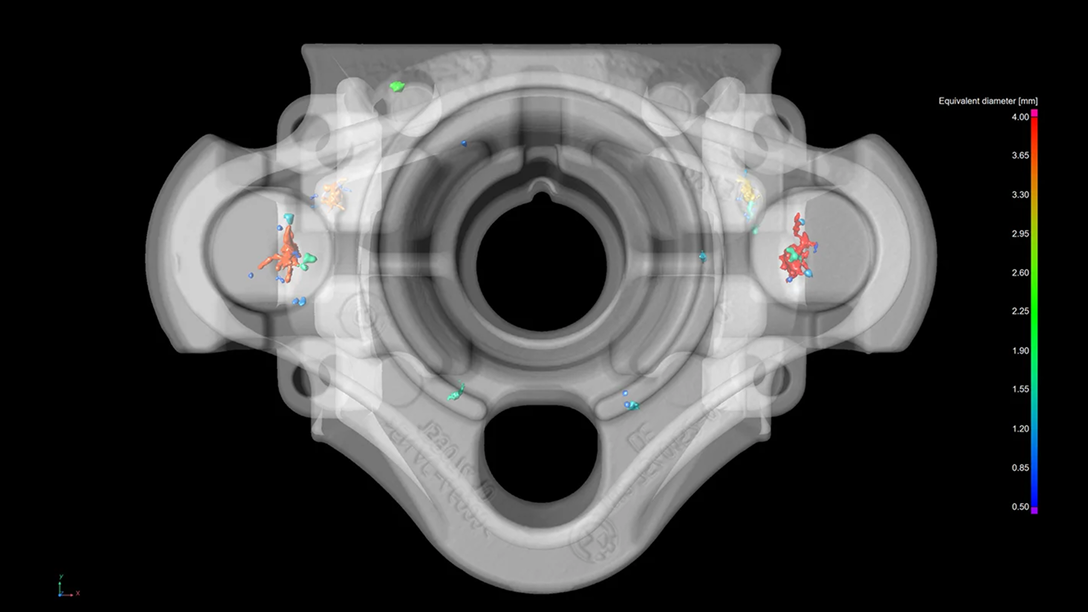
Images can also show all porosity parameters directly in the image by means of analysis markers, in addition to the position in the component
Manual and automatic image generation
- VG software offers various options to generate images of regions and discontinuities.
- If desired, these images can also display all porosity parameters directly in the image, using analysis markers in addition to the position within the part.
- Standard views, such as orthographic views of the casting with detected pores, can provide a clear overview of a part.
- Rule-based image generation enables you to automatically generate images in specific scenarios, such as when tolerance values are exceeded.
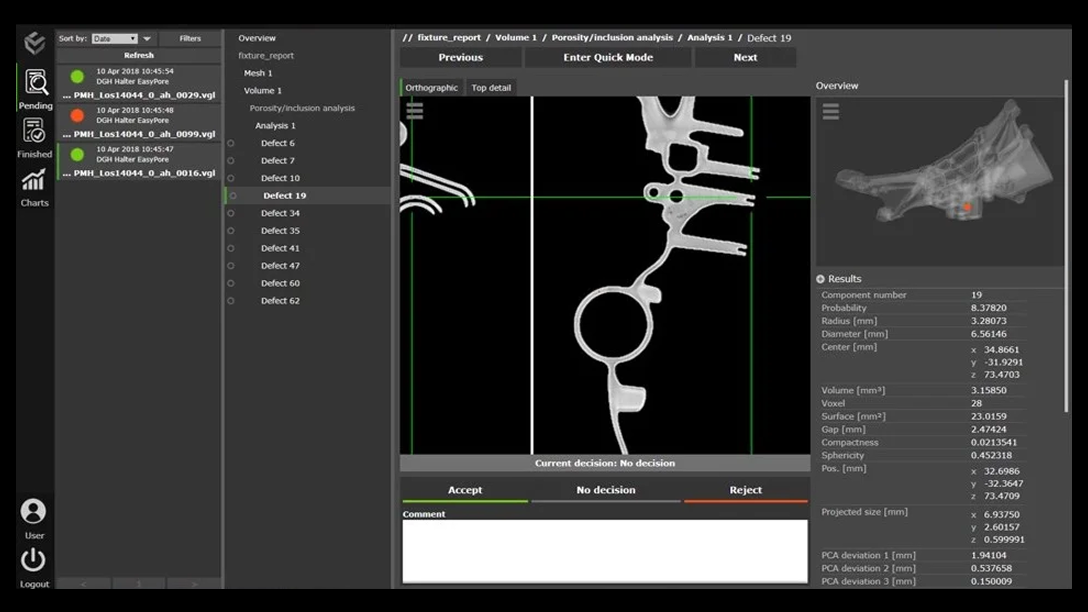
Manual re-evaluation of fully automatically inspected components in VGinLINE APPROVER
Automation
With VG software, you can partially or fully automate manual workflows with just a few simple clicks. This not only saves you time in your daily work but also provides the option to export your automated workflow to VGinLINE for use in an at-line or in-line CT environment.
Porosity analyses, in particular, offer a consistently high level of detectability, even in serial inspection, by taking production-related variations into account.
Modern reporting, statistical evaluations (Q-DAS), and a platform for manual re-evaluation of fully automatically inspected components (VGinLINE APPROVER) allow you to master the challenges of tomorrow's non-destructive testing today.
Reporting
Comprehensive reporting features allow you to share your results with different audiences, even if they're not using VG software.
The reporting features in VG software allow you to:
- Report not only the results but also document the evaluation process itself.
- Create highly customisable reports.
- Export results in the industry-standard Q-DAS format to visualise dependencies between production parameter adjustments and changes in part quality.
Use of results in simulations
Use the results of a porosity analysis in subsequent simulations to further investigate the effect of the defect.
The simulation features in VG software connect porosity/inclusion analysis to the simulation world:
- Exporting the porosity values to volume meshes (Abaqus, Patran, and Nastran).
- By meshing macropores.
- By simulation right within VGSTUDIO MAX, such as in the Structural Mechanics Simulation module.
Inclusion analysis
Inclusion analysis
Detect particles within your part
The analysis of discontinuities can refer to the absence of material—the classic pore/voids analysis—as well as the presence of foreign particles.
With VG software, you can detect unwanted contamination, such as in cases of machine wear, or explore the intended accumulation of added functional particles, such as metal flakes inside an insulator. All parameters mentioned for porosity can also be determined for inclusions.
VGDefX
— The Swiss Army Knife among porosity/inclusion detection algorithms
— It handles almost any scenario, from small gas pores to large-scale microstructure loosening
— Good results even on very noisy data sets
— Algorithm can be optimised for different porosity characteristics
Only threshold
— A simple, contrast-based porosity/inclusion analysis for components with a low noise and high contrast level
— Very well suited for multi-material data sets
— Intuitive use
— Accurate preview function
— Short calculation times
VGEasyPore
— Locally adaptive algorithm which performs very well on low contrast CT datasets
— Ideal for fully automated environments, as changes in contrast can be compensated automatically
— Intuitive use
— Accurate preview function
— Short calculation times
P 202/P 201
— Porosity and single-porosity detection according to VDG and BDG guidelines
— Provides transparent test specifications for suppliers and customers
— Fully digital, non-destructive "micrograph" inspection
— Inspection of 2D cut surfaces in 3D
— For predominant use in the automotive sector
— Accurate preview function
P 203
— Porosity and single-porosity detection according to BDG guideline P 203
— Provides transparent test specifications for suppliers and customers
— In contrast to P 202/P 201, offers complete volumetric detection of porosities
— Customised porosity evaluation and porosity selection (filtering) in ROIs (images from different regions with different porosity keys)
— Intuitive porosity key generation
— Precise preview function and easy navigation
Porosity/inclusion analysis algorithms
VGSTUDIO MAX offers various porosity/inclusion analysis algorithms to ensure optimal porosity detection for each part and scenario. Why? Because in 3D imaging using computed tomography (CT), image quality can be influenced by many factors. For example, short acquisition times in everyday industrial use, as well as large parts and multi-material scenarios, can all lead to reduced image quality. Noise, streak artifacts, contrast and grey value differences, and metal artifacts are additional factors that can affect the image quality.
Trusted by hundreds of users in the casting and injection moulding industries, VG software reliably detects critical discontinuities, such as pores and cracks, even in lower-quality data, ensuring you never miss a crucial flaw. Endorsed by industry leaders like Volkswagen, our implementation of BDG Guidelines P 201, P 202, and P 203 stands as a testament to our commitment to quality and reliability.
Customize your evaluation with user-defined filtering of relevant discontinuities, ensuring you focus on what matters most. Adapt tolerancing criteria to different ROIs for precise quality control. With VG software, gain the insightful analysis results you need to make informed decisions and enhance product integrity.
Automate your evaluations with seamless detection of discontinuities and replication of analysis regions for consistent accuracy. Experience fast processing, even with large data sets, and ensure comprehensive reporting for full transparency. Our workflow is fully automated, with optional manual review for added flexibility and control.
Contact us today—our team is ready to assist!
Request a quote