We hope you had a safe and warm New Year's celebration! But in light of recent times, that does not mean we have to forgo the fireworks completely. In fact, we can use VGSTUDIO MAX to start the year off with a (virtual) bang!
We've dug these strips out of our data set vault, but what kind of firecrackers are they, exactly? It would be good to know before lighting them up if they are ground-based fountains or full-blown finale racks!
If you know your fireworks, you can probably tell at first glance, but we're not quite so well versed in the art of pyrotechnics.
Without further ado, let's take a look inside.
By upping the transparency, we can see more clearly that the tubes are connected through a single fuse, and that each casing is filled with pellets of some sort. Let's use the Foam/Powder Analysis (FPA) module of VGSTUDIO MAX to see the contents more clearly.
You can see a bit of what's inside the cardboard casings.
If we use a foam/powder analysis, we can get an even better look.
Foam/powder analyses allow us to segment a network of connected powder grains into separate components that can be visualized and analyzed more carefully. It is perfect for densely packed objects, such as powders and pellets—"stars"—in a firecracker.
Specifying a merge threshold helps us separate the stars so we can visualize each one more clearly and color them based on a property (e.g., volume) to our heart's content. The higher the value, the more "connected" the network is. That said, if we want to examine individual components, we generally want to use a lower value.
A peek inside an individual tube
A quick rundown of how firecrackers work: We can see fine powders at the lift charge of each firecracker. When the powder is confined at the bottom and ignited, the trapped heat and gas will explode and propel the firework into the sky.
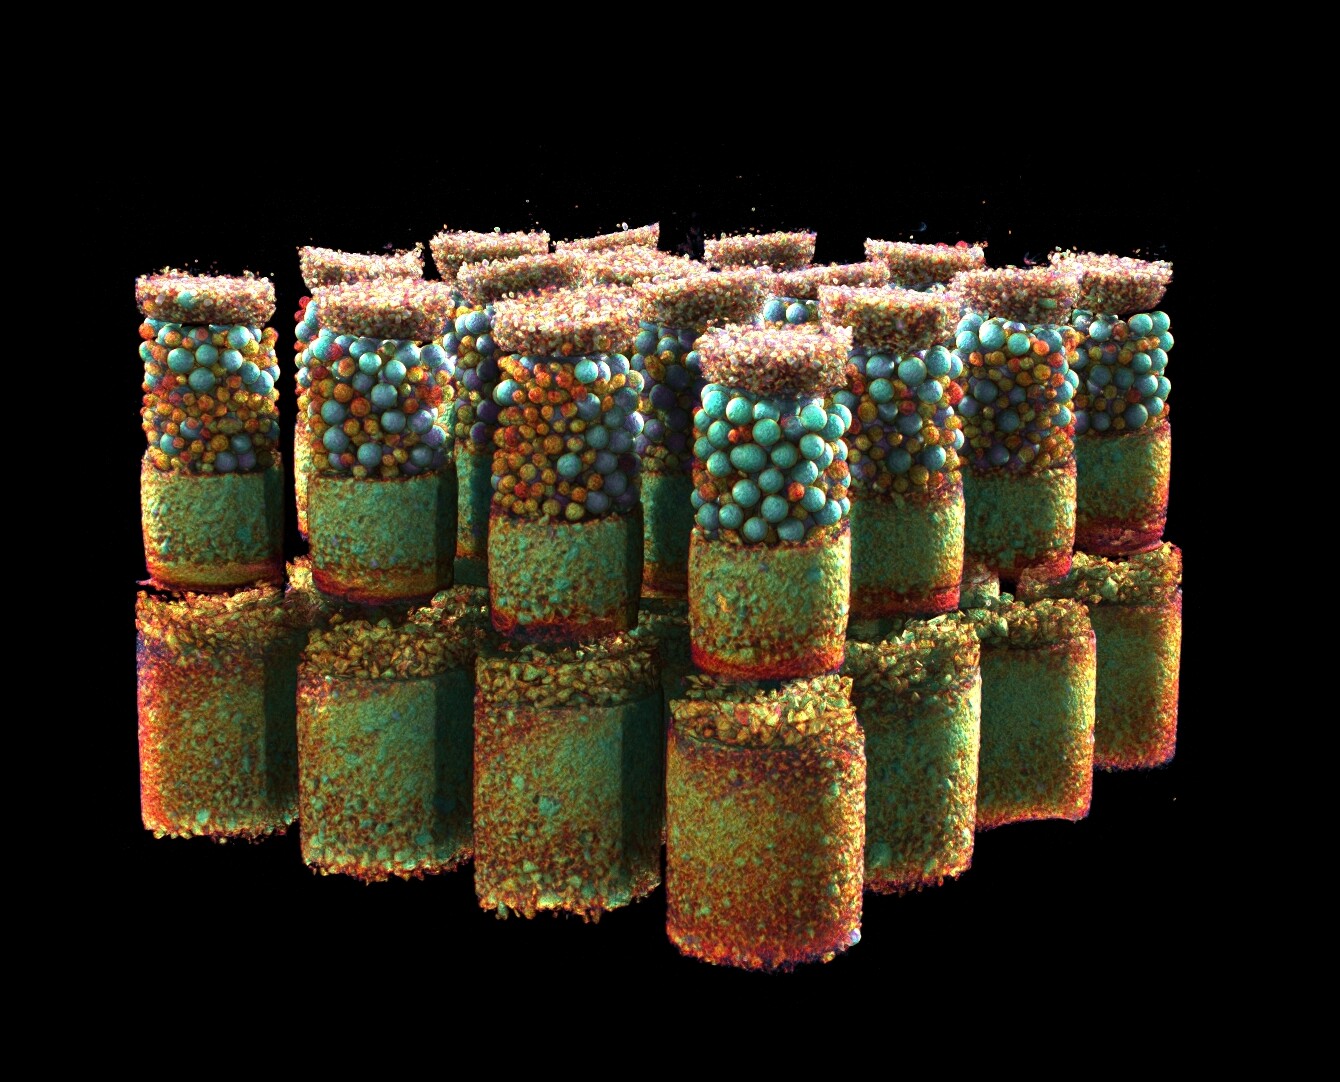
The differently colored "stars," which look like candy in the image above (but in reality contain very non-edible metal salts and iron filings), explode in a wide range of colors, depending on the compound.
In other words, we probably want to be outside—far from anything else—if we want to light them up!
However, setting up an individual foam/powder analysis for 16 tubes is a bit tedious—and keep in mind that some firecrackers have up to 200 tubes! To make it easier, as with many things, we can just use copy-paste.
We're Sensing a Pattern...
View from above. The firecrackers are arranged in a convenient, grid-like pattern
Fortunately, the uniform spacing means we can work with ROIs! We can start by creating an ROI of one tube in one of the corners. Generally speaking, working with patterns is easier when the x- and y-values of the starting ROI are the same, so let's go with square.
Once we have our ROI, we can run all the analyses we want on it—in this case, a foam/powder analysis. We want to use this ROI as a starting point from which we can copy and paste analyses on to the other tubes. But before we can actually create the pattern, we need to determine the spacing between tubes.
A quick fix for cases like this is the "distance" tool in the "instruments" menu. We can simply drag the tool from one end of a tube to the same end of another, once horizontally, and once vertically.
A square ROI for the tube in the upper left, and a couple of distance measurements in the x- and y-directions
In this case, we have roughly 3.8 cm (x) and 3.7 (y). Let's create a pattern based on these values. Simply copy the ROI and paste the pattern of ROIs, which we can find in the "edit" menu.
If everything looks sound in the preview, we're good to go! All the analyses we've run on the initial ROI will also be run on the rest. Just remember to update all the analyses!
We can input the values to define the pattern. Just make sure you're in the "multi-apply" tab!
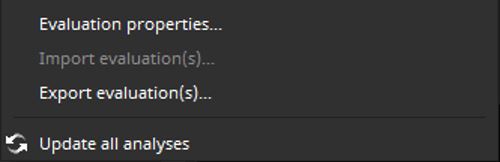
If nothing happens, it's probably because you haven't clicked here yet. You can find it at the bottom of the "analysis" menu
A bit of eye candy before you go