These are some of the main benefits of integrated reporting:
- Creation of different report types: project reports and part reports
- Transferable part reports (included in evaluation templates or via copy and paste)
- Intuitive editor for viewing and editing reports
- Customisable page layouts
- Creation of entirely customised report pages
- Reusability of customised templates
- Automatable report creation
- Integration of custom images and custom text into reports
- Reports are independent objects in the VG project that can be viewed and edited
- Export of well-formatted PDFs regardless of the report size
- Creation of multiple reports from the same project for different audiences
The reporting function is continuously evolving with exciting new features. Depending on your version, you may not have access to all features described in these FAQ.
- Project reports include information about an entire project and usually reference several arbitrary objects in the project. They are displayed beneath the Scene item in the Scene Tree.
- Part reports contain information about an individual volume, CAD, or mesh object. They will become part of evaluation templates and can also be transferred to similar objects via copy and paste.
- In the Scene Tree, highlight the Scene item or the objects you want to include in your report. You can highlight multiple top-level objects or reportable content belonging to different top-level objects.
- Right-click a highlighted item and select Create > Report from the context menu or click Create report on the Reporting tab.
- In the Scene Tree, highlight an individual top-level object or one or more child items of a top-level object.
- Right-click the highlighted item and select Create > Report from the context menu or click Create report on the Reporting tab.
Export an evaluation template and import it to other parts, or copy a part report and paste it to other parts. Note that originally reported content that does not exist on the other parts will be removed from the pasted report.
This function can be accessed via the Reporting tab or via the context menu in the Scene Tree.
A report consists of multiple section groups. When you create a new report, a dialog is displayed where you can select the content to be added to the report. In the reporting dialog, the section groups are listed in the left column:
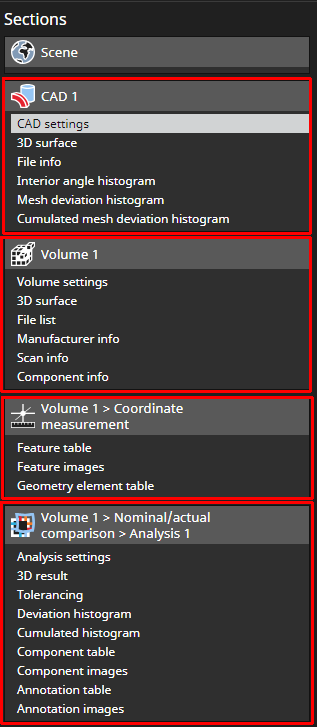
You can add or remove sections from the individual section groups. To be able to do so, you have to switch to Edit mode.
Each section contains layout elements and content from the reported objects.
- In the Scene Tree, highlight the object(s) you want to include.
- Select Create > Report from the context menu of the Scene Tree or click Create report on the Reporting tab.
- In the upcoming dialog, select the exact content to be reported.
- Reported objects may provide additional content, such as rule-based images or views that are listed below the object to which they belong.
- You can save a report in PDF or HTML format by
- clicking Export in the reporting dialog or
- via the Export PDF or Export HTML button on the Reporting tab.
- When you save your project, the report will be saved as part of it. You can view it or continue editing it at any time.
There is no difference in the capabilities of the Reporting function in myVGL compared to other VG software. However, you cannot save the project.
- If you open a project with a report with version 3.4.5 or older, the report will not be loaded at all.
- If you open a project with a report with version 3.5.0 or newer but older than the report was created with, the report will be loaded. It can be viewed in the reporting dialog, but it cannot be edited and/or exported as PDF.
- If you open a project with version 3.5.0 or newer that contains a report created after the introduction of the part/project report concept in version 2026.1, project reports will be shown, whereas part reports will be dropped and a warning will be displayed.
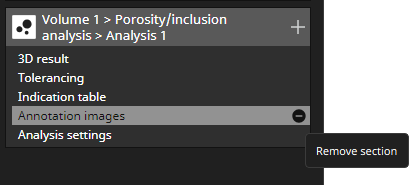
Pages are always part of a report section. Individual pages can’t be removed from a section but you can remove the entire section from the report.
- Switch to Edit mode.
- You can delete a section in the Sections area on the left-hand side by clicking the (-) icon next to the section name.
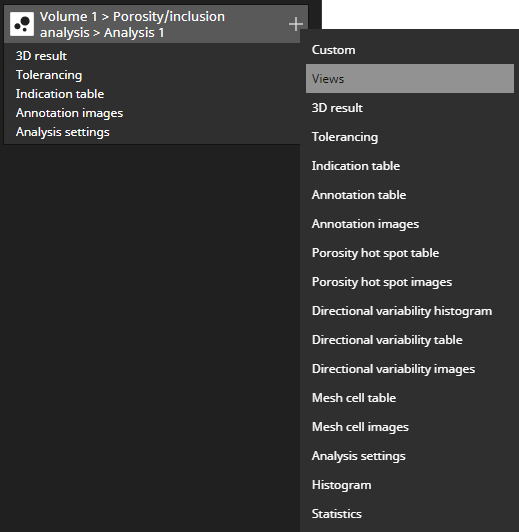
- You can add a section in the Sections area on the left-hand side by clicking + :
- If you want to create a customized report, you first need to export your report layout.
- Record a macro in which you create a report using a layout file or the built-in default layout.
- The recorded macro can then be used, for example, in batch processing or played back in VGSTUDIO MAX or VGinLINE.
- On the Reporting tab, click Create report or Configure report.
- On the right-hand side of the upcoming dialog, go to the Image creation tab.
- Under General settings, specify the Image size (number of pixels for larger side). This sets the maximum size for the entire report.
- On the Reporting tab, click Create report or Configure report.
- On the right-hand side of the upcoming dialog, go to the Image creation tab.
- Under Focused 2D image settings, specify the desired Zoom factor.
- On the Reporting tab, click Create report or Configure report.
- On the right-hand side of the upcoming dialog, open the Image creation tab.
- Under Contents on the left, select the object or analysis you want to specify individual settings for.
- This brings up the option Use the image creation settings specified for the scene on the right. Uncheck it to re-activate the other options.
- Under General settings, specify the desired Image size (number of pixels for larger side).
- Under Focused 2D image settings, specify the desired Zoom factor.
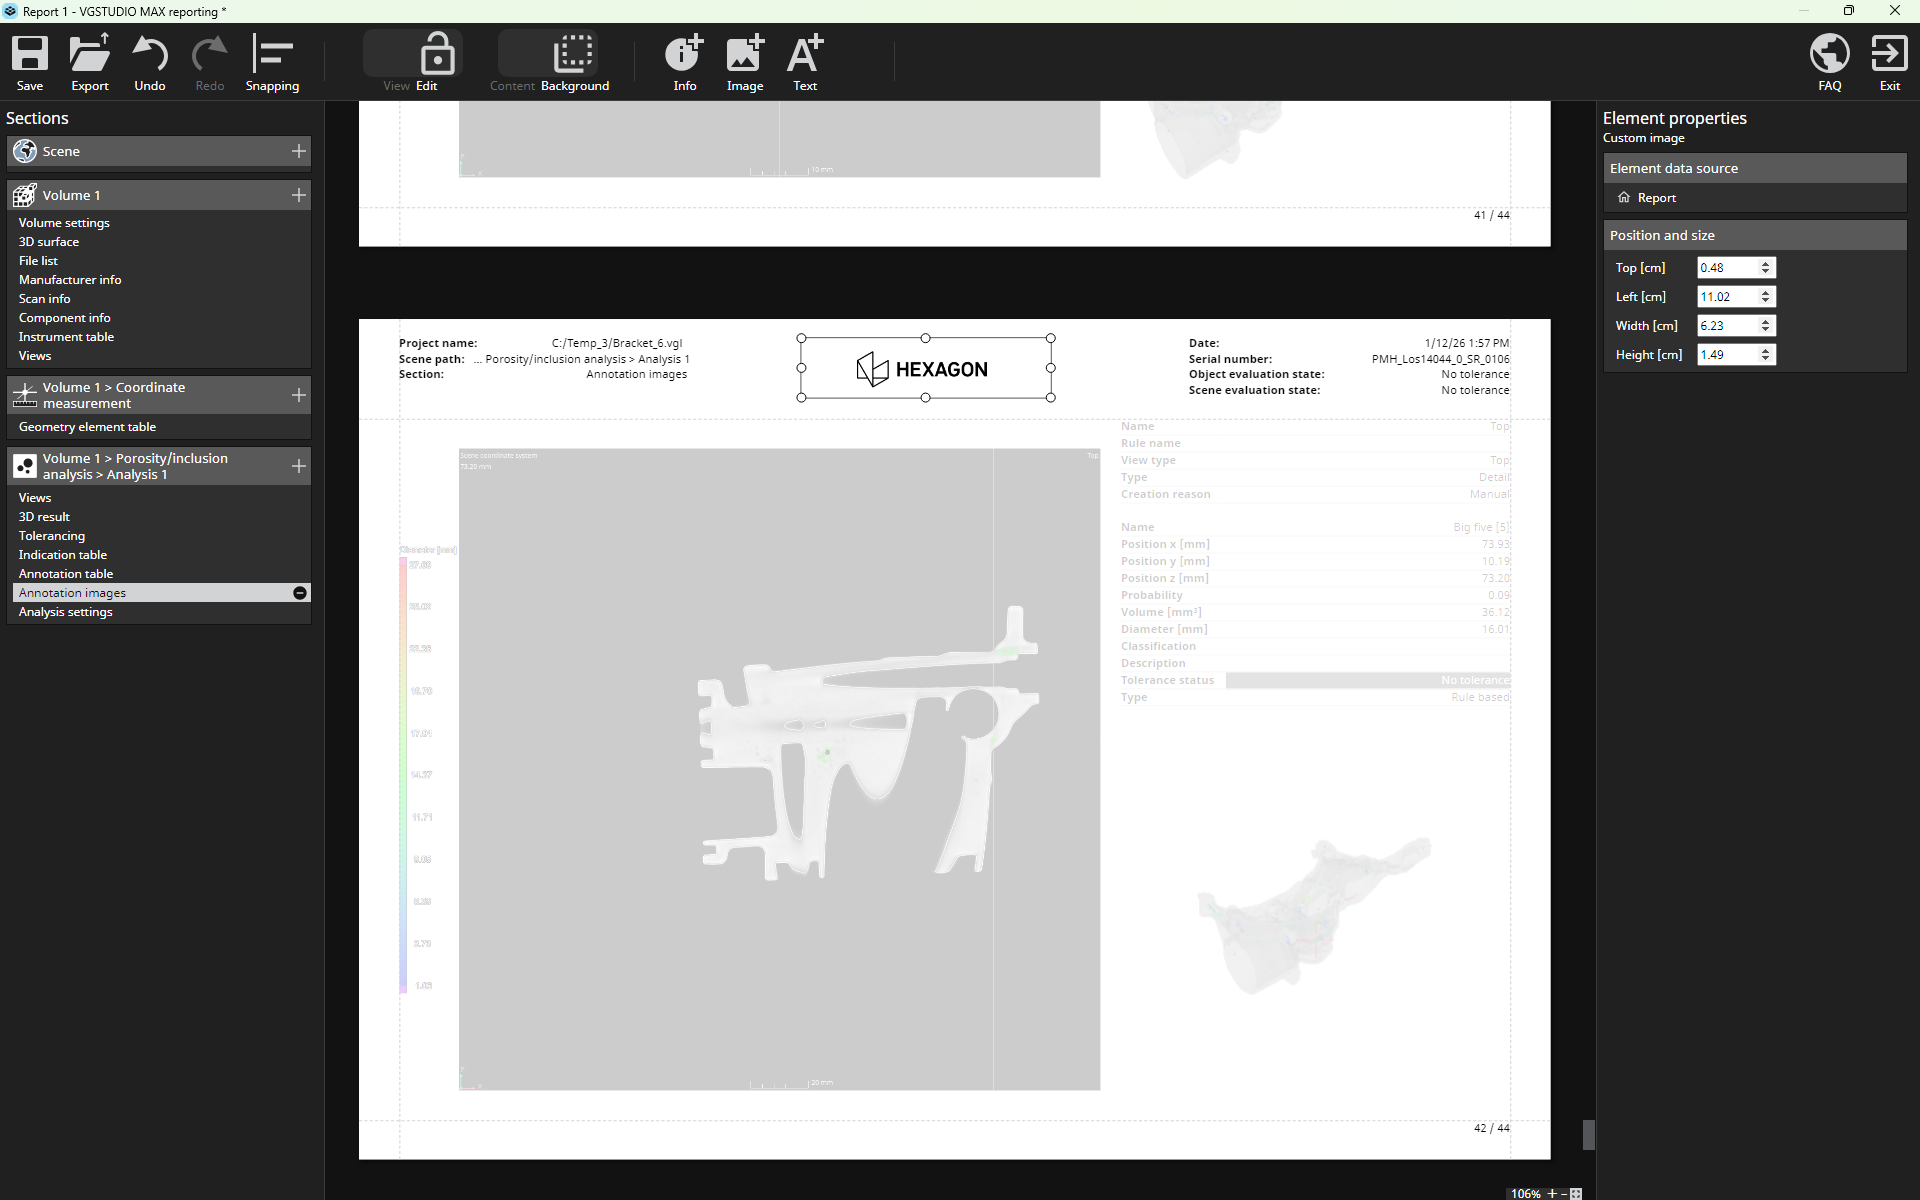
- Switch to Edit mode. Reports have a background that is repeated on every page and content that is specific to the individual pages. Tables are content, so make sure that Content mode is active.
- Select a table to have its Element properties displayed on the right-hand side.
- There you can change the sorting of the columns, the position and size of the table, define which columns to display, etc.
- Switch to Edit mode and make sure you're in Content mode.
- Select a table to have its Element properties displayed on the right-hand side.
- In the Column display section, drag and drop columns to change their order.
- Adjust the width of a column by dragging its borders in the table.
- Switch to Edit mode and make sure you're in Content mode.
- Select the table you want to adjust to have its Element properties displayed on the right-hand side.
- In the Column display section, check the Follow application layout option.
- Add a Custom section to the Scene section or any other section.
- In the Custom section, you can add text and/or images.
- You can rearrange these elements via drag and drop.
- You can also copy and paste elements from any other section in the report via the context menu or Ctrl+C/Ctrl+V.
- Switch to Edit mode and activate the Background mode.
- In this mode, you can define information that is to be displayed on each page.
- Switch to Edit mode.
- Select Image > Custom image and select the image or copy and paste the image from the clipboard.
- Switch to Edit mode.
- Change the order of objects and sections by using drag and drop in the Sections section on the left-hand side.
- Switch to Edit mode.
- You can move the elements with the left mouse button (drag and drop).
- Under Element properties on the right-hand side, you can adjust the values in the Position and size section.
- To change the order of overlapping elements, use the corresponding commands from the context menu.
Copy the content from one object or analysis (e.g., image or table) and paste it to the desired page. The initial content can be deleted. For some content, such as coordinate measurement results, there also exist dedicated overview tables that can be added via the main menu and that display all available results in a single table.
- Switch to Edit mode.
- Click Text.
- Select Custom text.
- Export the layout of an existing report. If your report creates layout elements that reference certain content absolutely, you will only be able to create a specific report layout:
- Select the report in the Scene Tree.
- Click Export default layout or Export specific layout on the Reporting tab to export the layout.
- Reuse this layout:
- Click Create on the Reporting tab.
- On the right-hand side of the upcoming dialog, open the General tab, and in the Layout section, select Specific to choose the desired layout from the Add specific layout list.
- An easy way to reuse a customized layout is to use part reports:
- Copy a part report and paste it to one or more similar objects.
- Update the pasted part reports to resolve any absolute references. This eliminates the need for specific layouts.
A default report layout stores a layout based on the reported object types, such as volume objects, CAD models, surface meshes, ROIs, analyses, geometry elements, and GD&T features, and the global background layout.
When you create a report, all section groups based on objects of the same type will use the same section configurations and layouts. Default report layouts can be applied to arbitrary scenes.
A specific report layout defines the layout of a report for a specific scene content. The layout of section groups and sections of the same type can vary within reports with such a layout. The constellation of the objects to be reported must be the same as in the initial report the layout is based on.
- Switch to Edit mode.
- Double-click the custom text field.
- Select the text to be formatted.
- Change the text settings in the Element properties on the right-hand side.
- Switch to Edit mode.
- Go to the page with the first image.
- Resize the image (make it smaller).
- Copy and paste it on the same page and rearrange the images next to each other.
- Select the second (third, fourth, …) image and, under Element properties on the right-hand side, switch Content group to 2 (3, 4, ...).
- If you want to display related information, such as the attributes of images, you need to adjust the content groups of the copied and pasted attribute lists in the same way.
- This can also be applied to tables.
- In the reporting editor, click the padlock at the top to switch to Edit mode.
- Select the page where you want the overview table.
- At the top of the editor, go to Table > Overview and select the analysis you want.
- Switch to Edit mode.
- Via Info, you can include any information from the Scanner manufacturer, Scan, and Component tabs of the Object properties.
- Switch to Edit mode and select the section.
- Make sure no layout element is currently selected by clicking the empty space in the section.
- The section name can be changed in the Section properties on the right-hand side.
- When analysis results, analysis settings, metainformation, and images have changed and must be updated. The report layout and the number of reported objects will remain unchanged.
- When the language of the report must be changed to the current application language
- To change the analyses/objects included in the report
- To change the image settings
You can copy images, shapes, and text boxes from many other applications and paste them as images or text in your report.
- Create a report that contains the coordinate measurement of all objects.
- Open the report.
- Switch to Edit mode.
- Select Table > Overview > All coordinate measurement results. It can make sense to do this on a new page, which you can add by clicking the plus sign next to a section on the left-hand side and selecting Custom.
Sometimes, it's just easier to chat quickly to get back on the right track. Get in touch and let's get you the help you need!
Ask for help