Our next adventure takes us to Bern, Switzerland, to the nation's center of excellence for agricultural research—Agroscope. The institute prides itself on researching and contributing to a high-quality, sustainable food sector through nutrition and agricultural science. This rings especially true for its signature products, including the famous wheels of Emmental cheese. Only one question remains: Where have all the holes gone?
A simple question, but one worth its cheesy weight in gold. Different markets prefer different hole sizes in their cheese. For example, commercial manufacturers of sliced cheese prefer smaller holes in greater numbers, while other consumers favor walnut-sized holes. Being able to control the size and prevalence of these holes has quite literally become a billion-dollar challenge—one that becomes difficult to solve if the holes keep vanishing without a trace.
There are a few theories about what caused the holes to begin with, such as carbon dioxide bubbles released by bacteria, or that holes would occur in certain areas based on "crystallization patterns" that rely on small irregularities to trigger eye formation. Whatever the reason, cheese holes have been plaguing agricultural researchers for decades. It was only in recent years that researchers were able to use non-destructive testing methods on cheese to "poke holes" in the original theory and gain a better understanding of what, exactly, was happening beneath the surface.
Cheese holes: a relic of days past
VG Solution
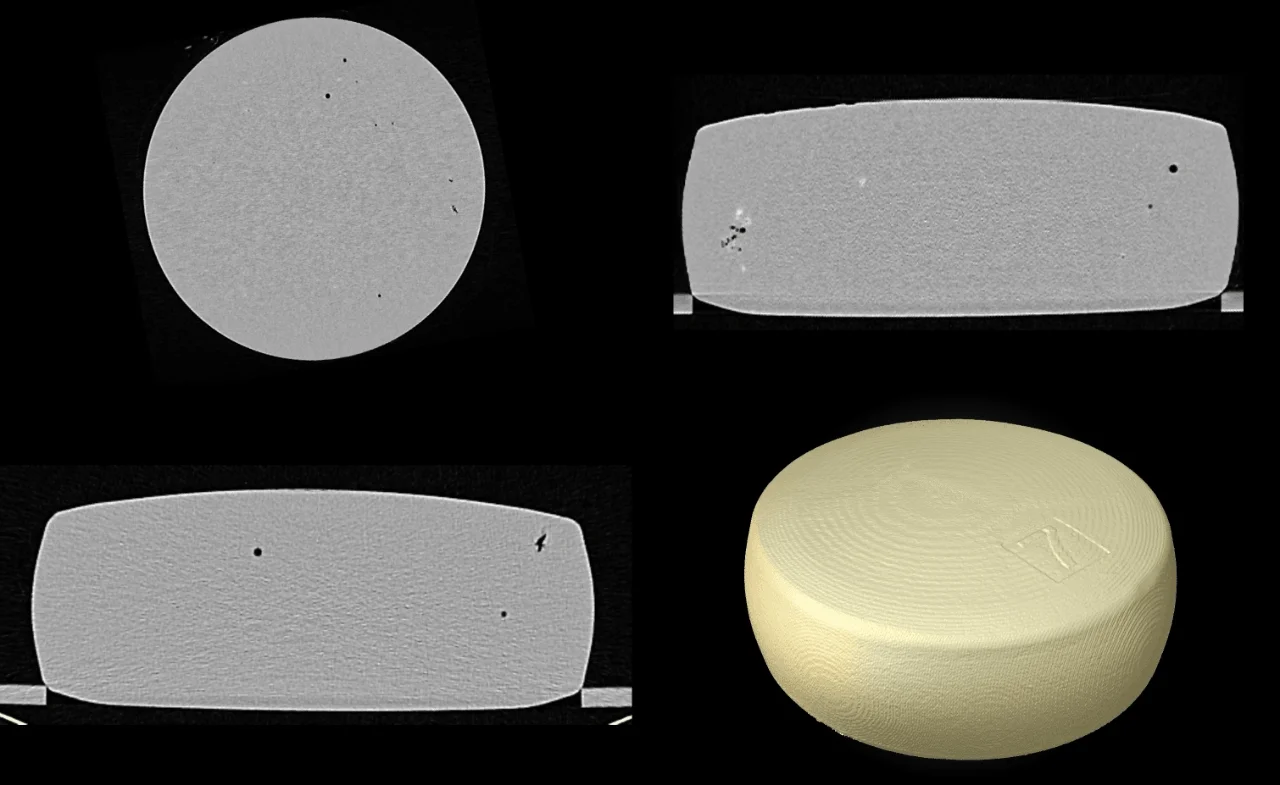
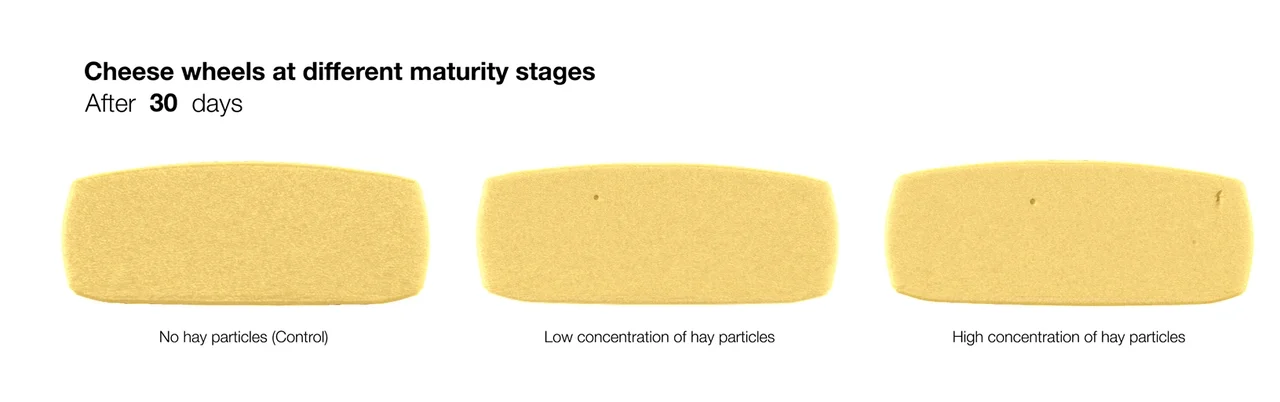
Equipped with VGSTUDIO MAX and a CT scanner from a nearby veterinary clinic, Agroscope was going to get to the bottom of this. Researchers prepared eight wheels of Emmental cheese with one replicate that differed only in the amount of hay particles added to each sample. It was not a simple case of analyzing a single scan but observing a series of scans capturing natural processes over time. As such, each wheel was observed throughout four different maturity stages: on day 30, 45, 60, and 130. On day 130, the contents of fat, water, citric acid, lactic acid, and volatile carboxylic acids were also measured.
4D CT technology shows the different maturity stages of a cheese wheel: at 30, 45, 60, and 130 days [Click to watch]
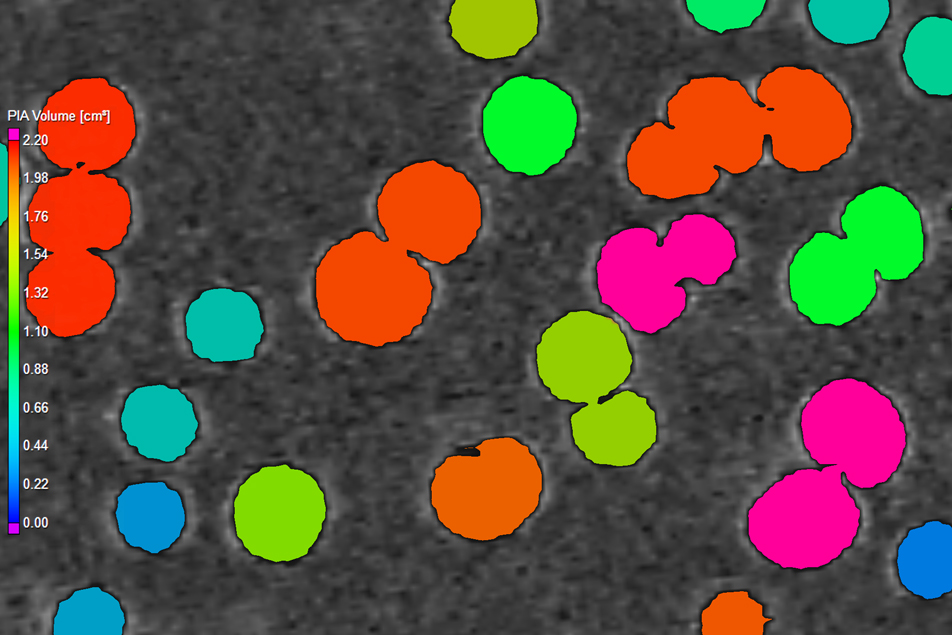
Example 1: When calculating the surface for a porosity/inclusion analysis (PIA), make sure the surface does not contain pores.
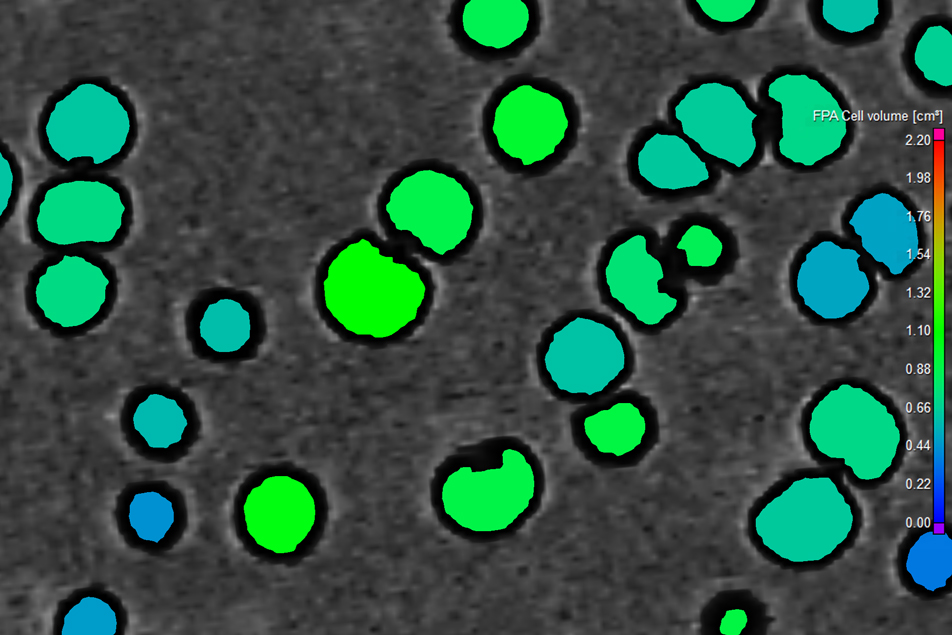
Example 2: In contrast to porosity/inclusion analyses, foam/powder analysis (FPA) works directly with the surface, so keep pores as part of the surface.
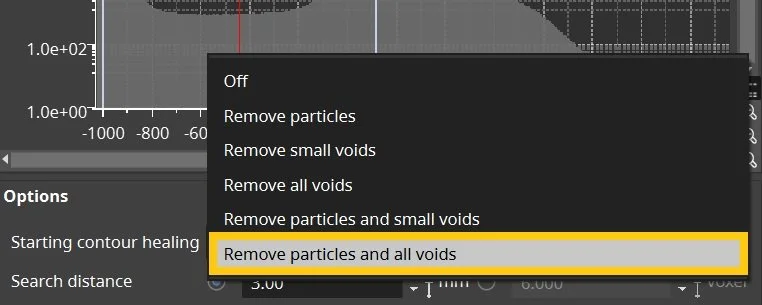
Using the Porosity/Inclusion Analysis (PIA) module of the software, the team was able to visualize the formation of holes along with each hole's position, diameter, and volume. Occasionally, holes would connect and even merge; in this case, foam/powder analysis (FPA) can account for every individual hole in each growth stage—even after they overlap—as opposed to PIA, which is mainly useful for gaining statistical information on combined holes. In the end, the team added the volumes of individual holes to determine the overall relative hole percentage of each wheel.
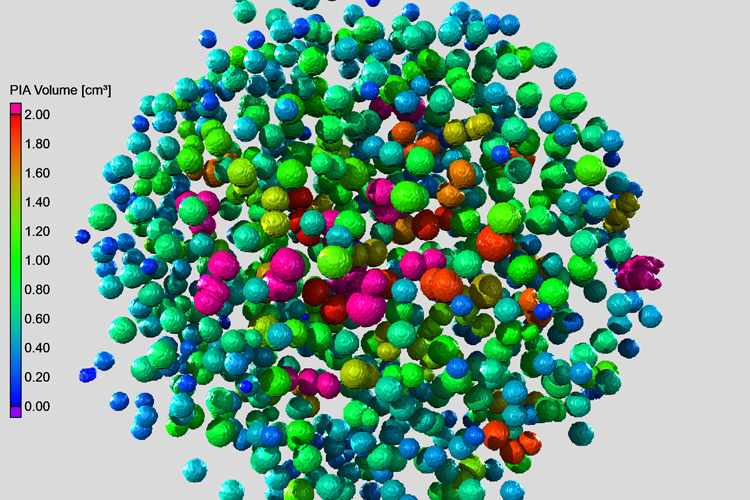
3D representation of a porosity analysis
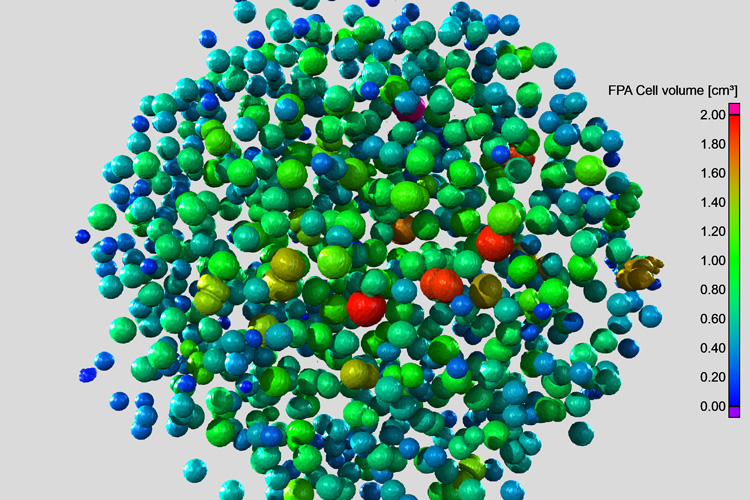
With foam analysis
Porosity analysis considers bubbles seamless voids
Foam analysis is able to distinguish them
While they were keeping track of hole behavior in the wheels, the team discovered something new: the absence of holes greatly increased the risk of crack formation in the cheese! Without cheese holes, high CO2 pressure causes the cheese to crack in the more advanced stages of maturity, which leads to a steady loss in product quality over time.
The Anatomy of a Cheese Hole
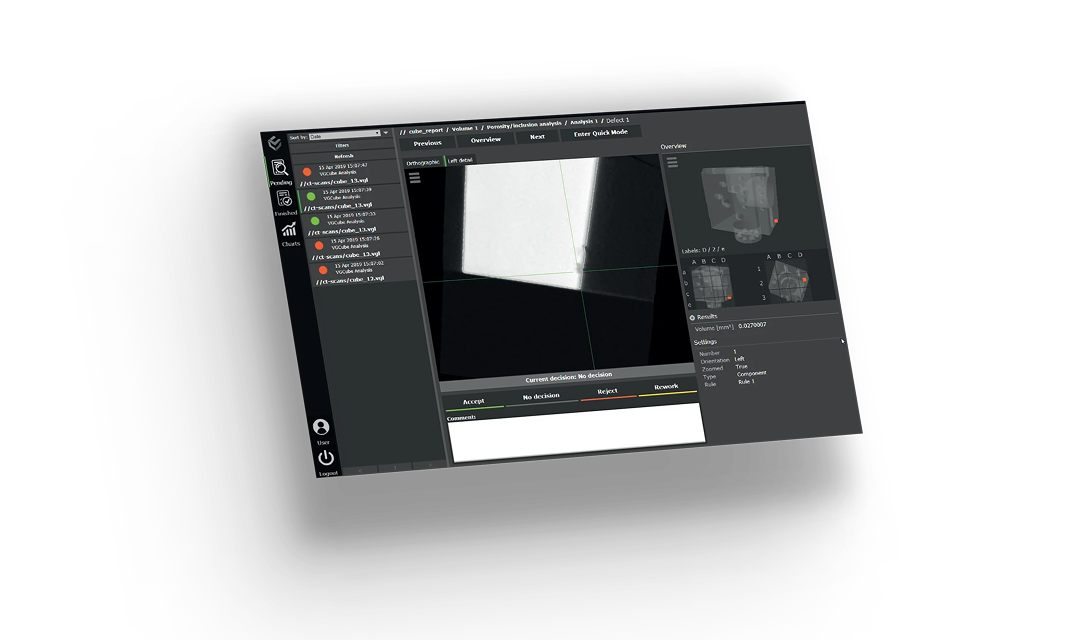
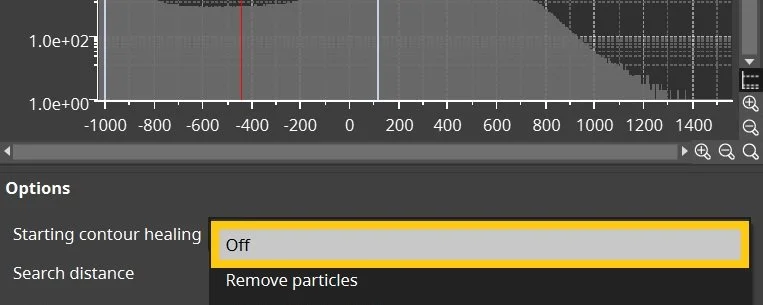
The golden rule to a porosity/inclusion analysis—with only few exceptions—is to perform a surface determination. Because the surface is generally the region of analysis, this ensures that each hole is considered part of the surface. Some holes, as pictured at Day 130, are composed of brighter, low-contrast gray values, which made it less than optimal for defining a global tolerance for the entire data set. A quick VGEasyPore analysis allowed us to examine local contrasts and account for both dark and light holes.
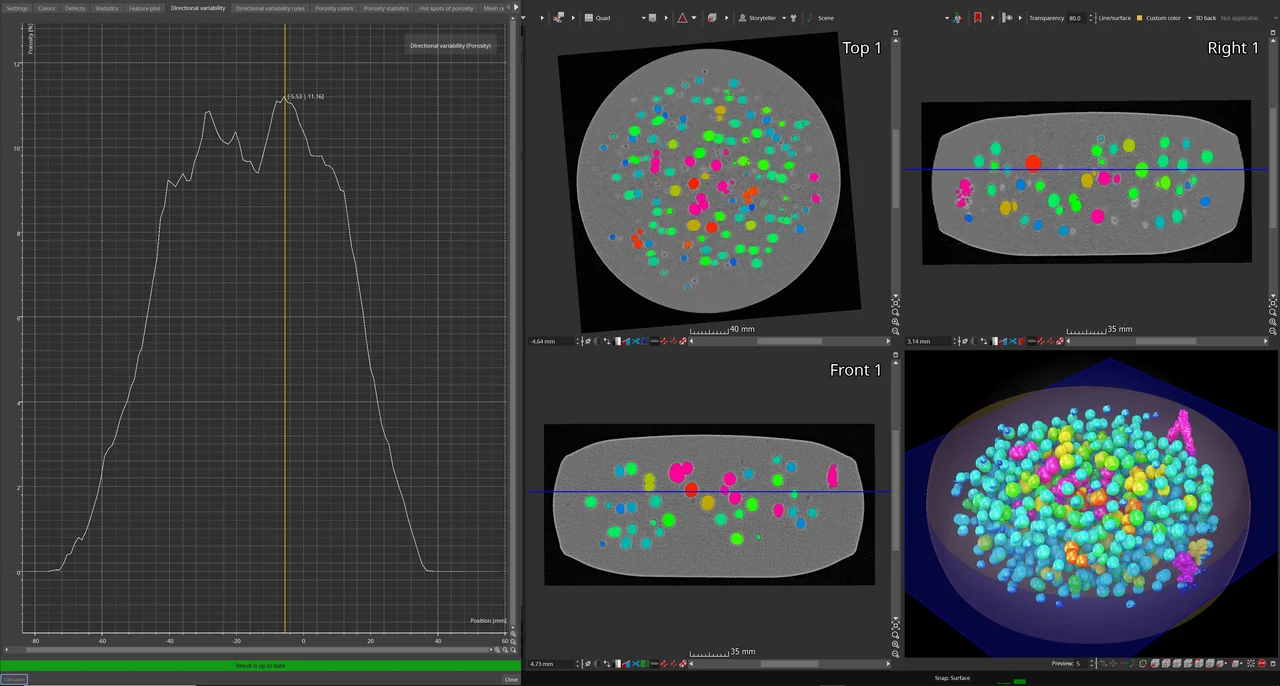
Directional variability shows us, that the bubbles are distributed more or less evenly along the vertical direction of the cheese wheel
As part of the porosity/inclusion analysis, we can apply directional variability to visualize how holes are distributed in a specified direction.
An additional option allows us to create an integration mesh that consists of sectors—or slices in the cheese wheel—and calculate the average porosity for each individual sector.
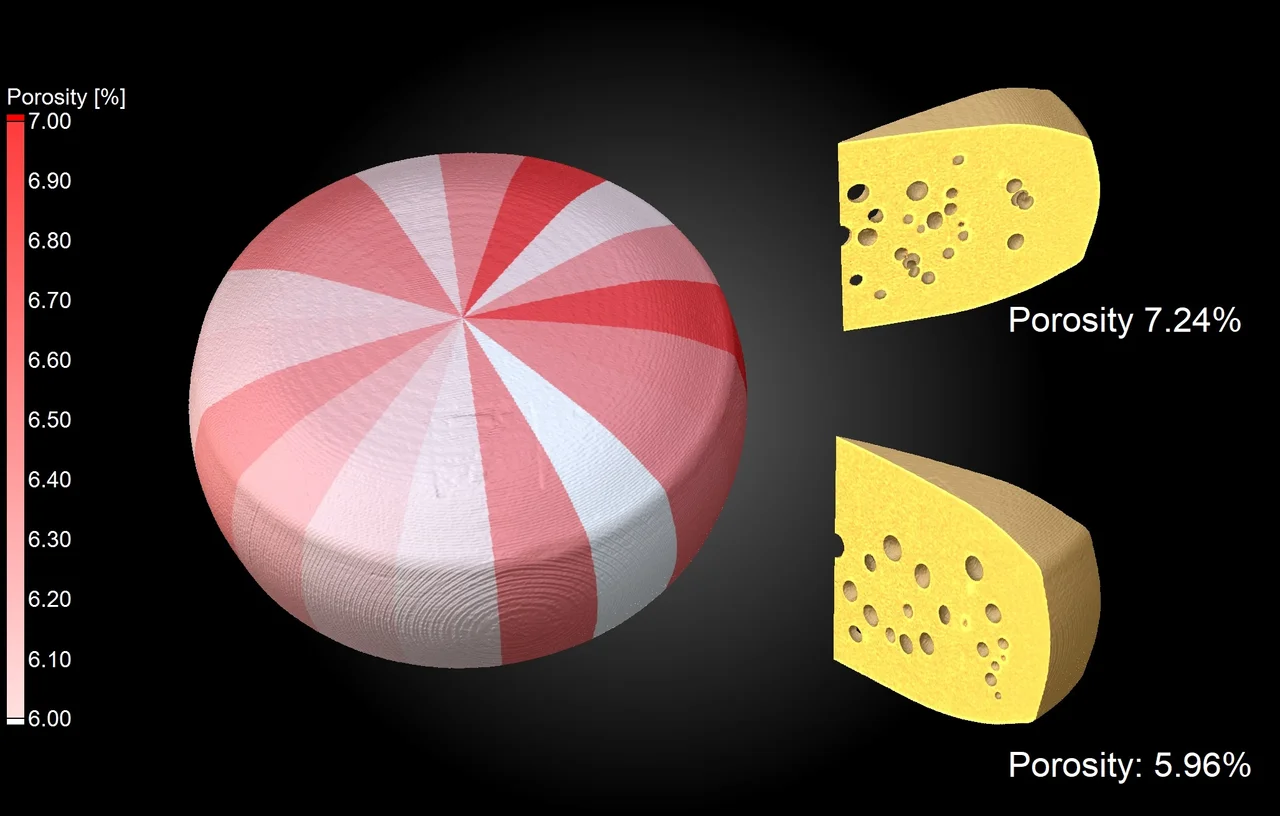
An integration mesh shows us that the porosity is quite consistent throughout the wheel, but there are still some sectors that are more porous than others. Which slice would you prefer?
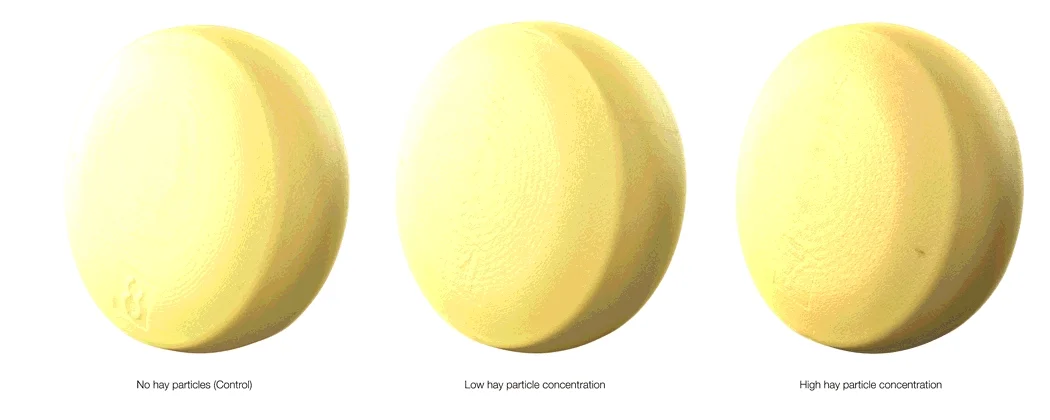
Through non-destructive testing and CT image analysis, researchers were able to confirm one of their running theories: it was all in the hay. While bacteria releases carbon dioxide, it still needs a small irregularity—like a particle of hay—to latch onto and gather around, forming larger bubbles. Closer microscopic investigation revealed that the capillary structures present in the hay functioned as optimal "seed points"; during the warm cheese-forming process, air trapped in the capillaries would expand and break free, attracting the carbon dioxide gas. By adding trace amounts of hay particles, researchers could therefore gain better control over hole formation in cheese.
For a more detailed, in-depth look into the process of eye formation in cheese, click here!
4D-CT at its best: The renderings clearly show the growth of the cheese holes over time.
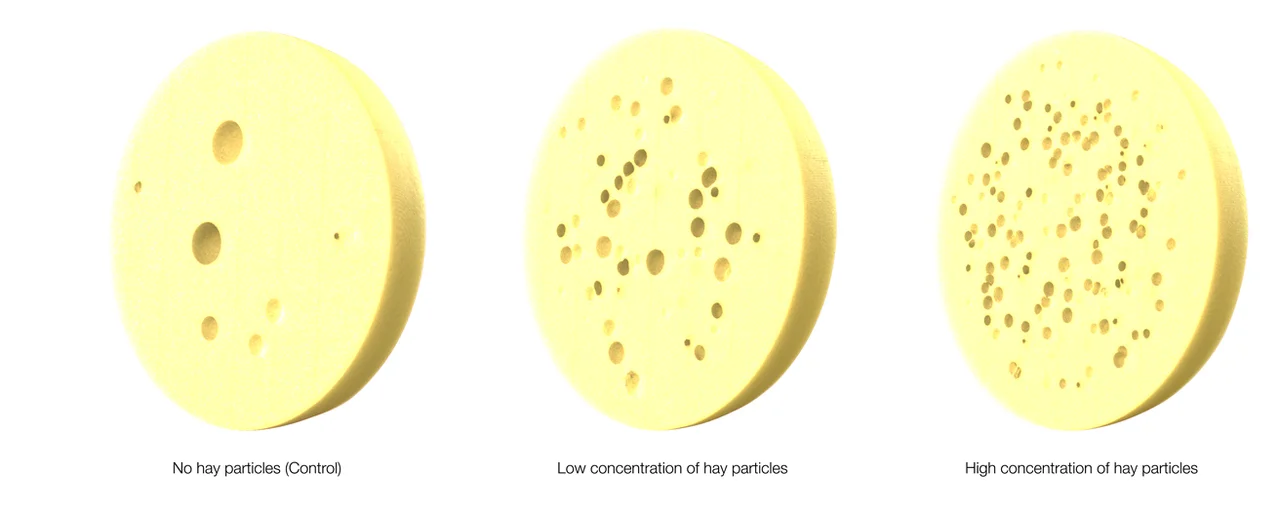
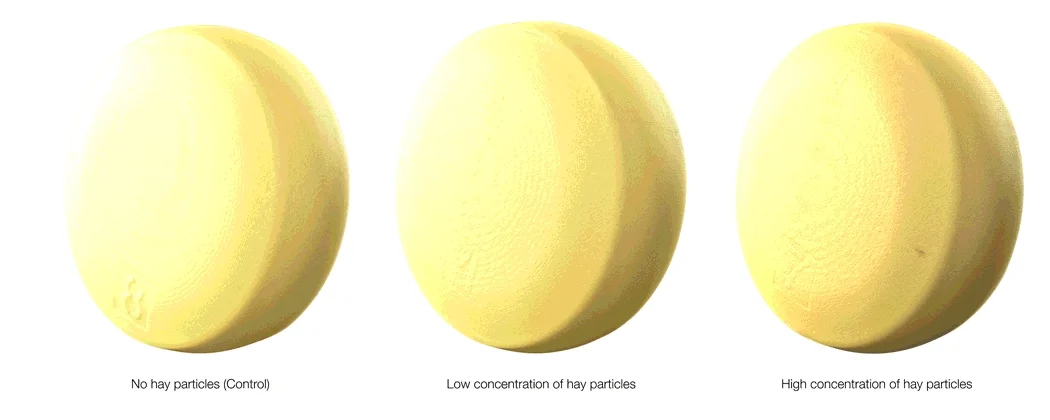
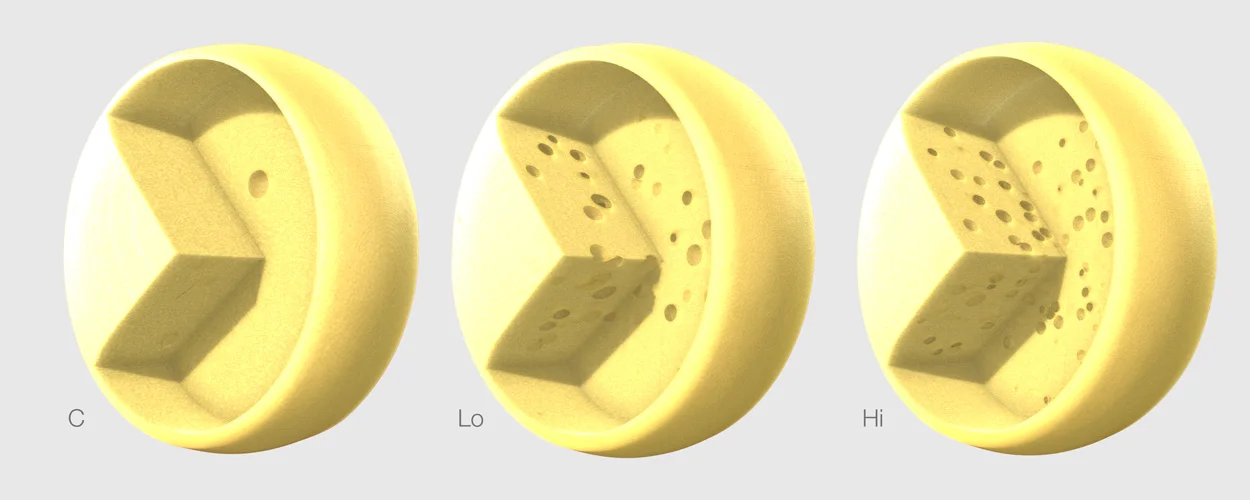
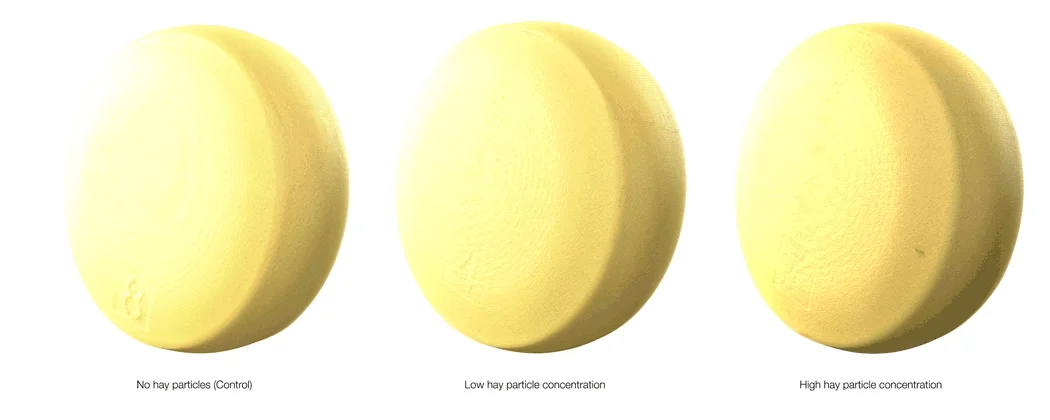
Comparing the results after 130 days of aging: how hay particle concentration affected hole formation in cheese
Visualization of the same holes as simple holes, as inverted bubbles (ROI from defect mask), and color-coded based on volume
Daniel Wechsler, project manager at Agroscope, would like to apply CT technology beyond the scope of cheese. "The successful non-destructive testing of hole formation in cheese using CT has totally convinced us. We can definitely imagine using CT and Volume Graphics software in other areas of food research that Agroscope is active in," he says.
Against the backdrop of technological advancements, it makes sense. In the past, milk was acquired from cows in green pastures, but this quaint and rustic image has all but disappeared from the dairy industry. The transition from age-old milking methods in barns to fully automated, industrial milking systems has made milk much cleaner—hay and other "dirt particles" do not make it into the final product. In other words, the culprit behind the missing holes is the milk itself: it's simply too clean.
Now for a Bit of Fun!
Every now and then, you'll come across data sets that are just asking to be explored. This is one of them. Why resist the temptation?
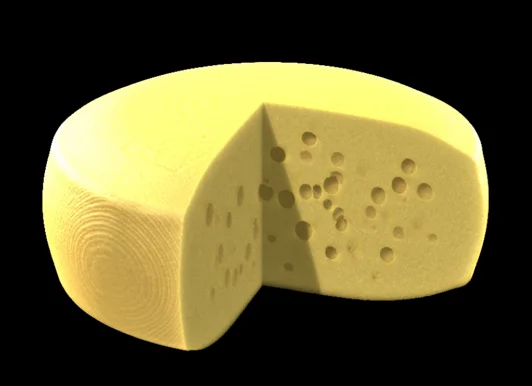
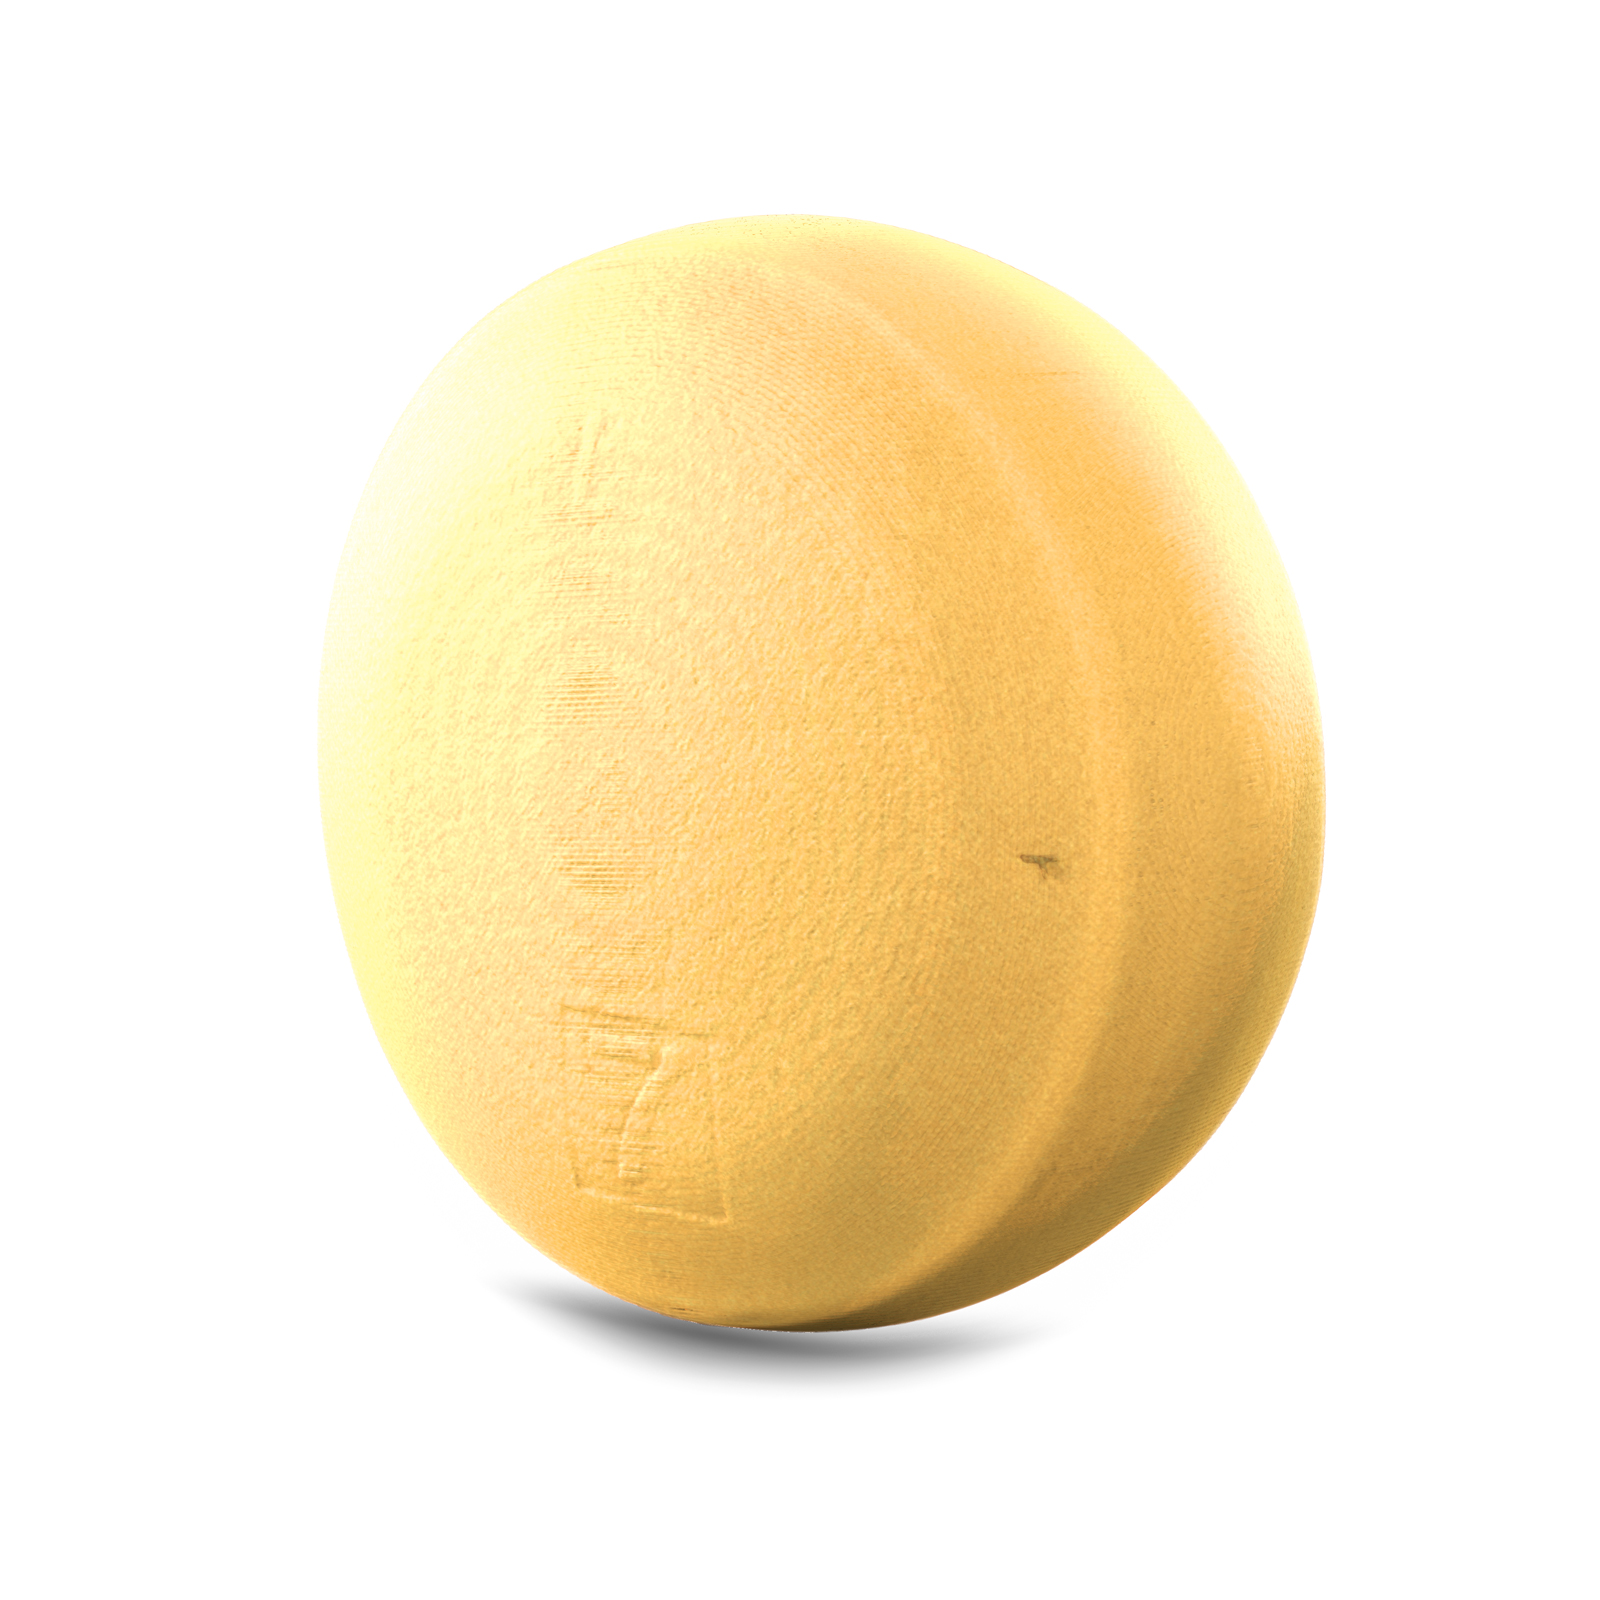
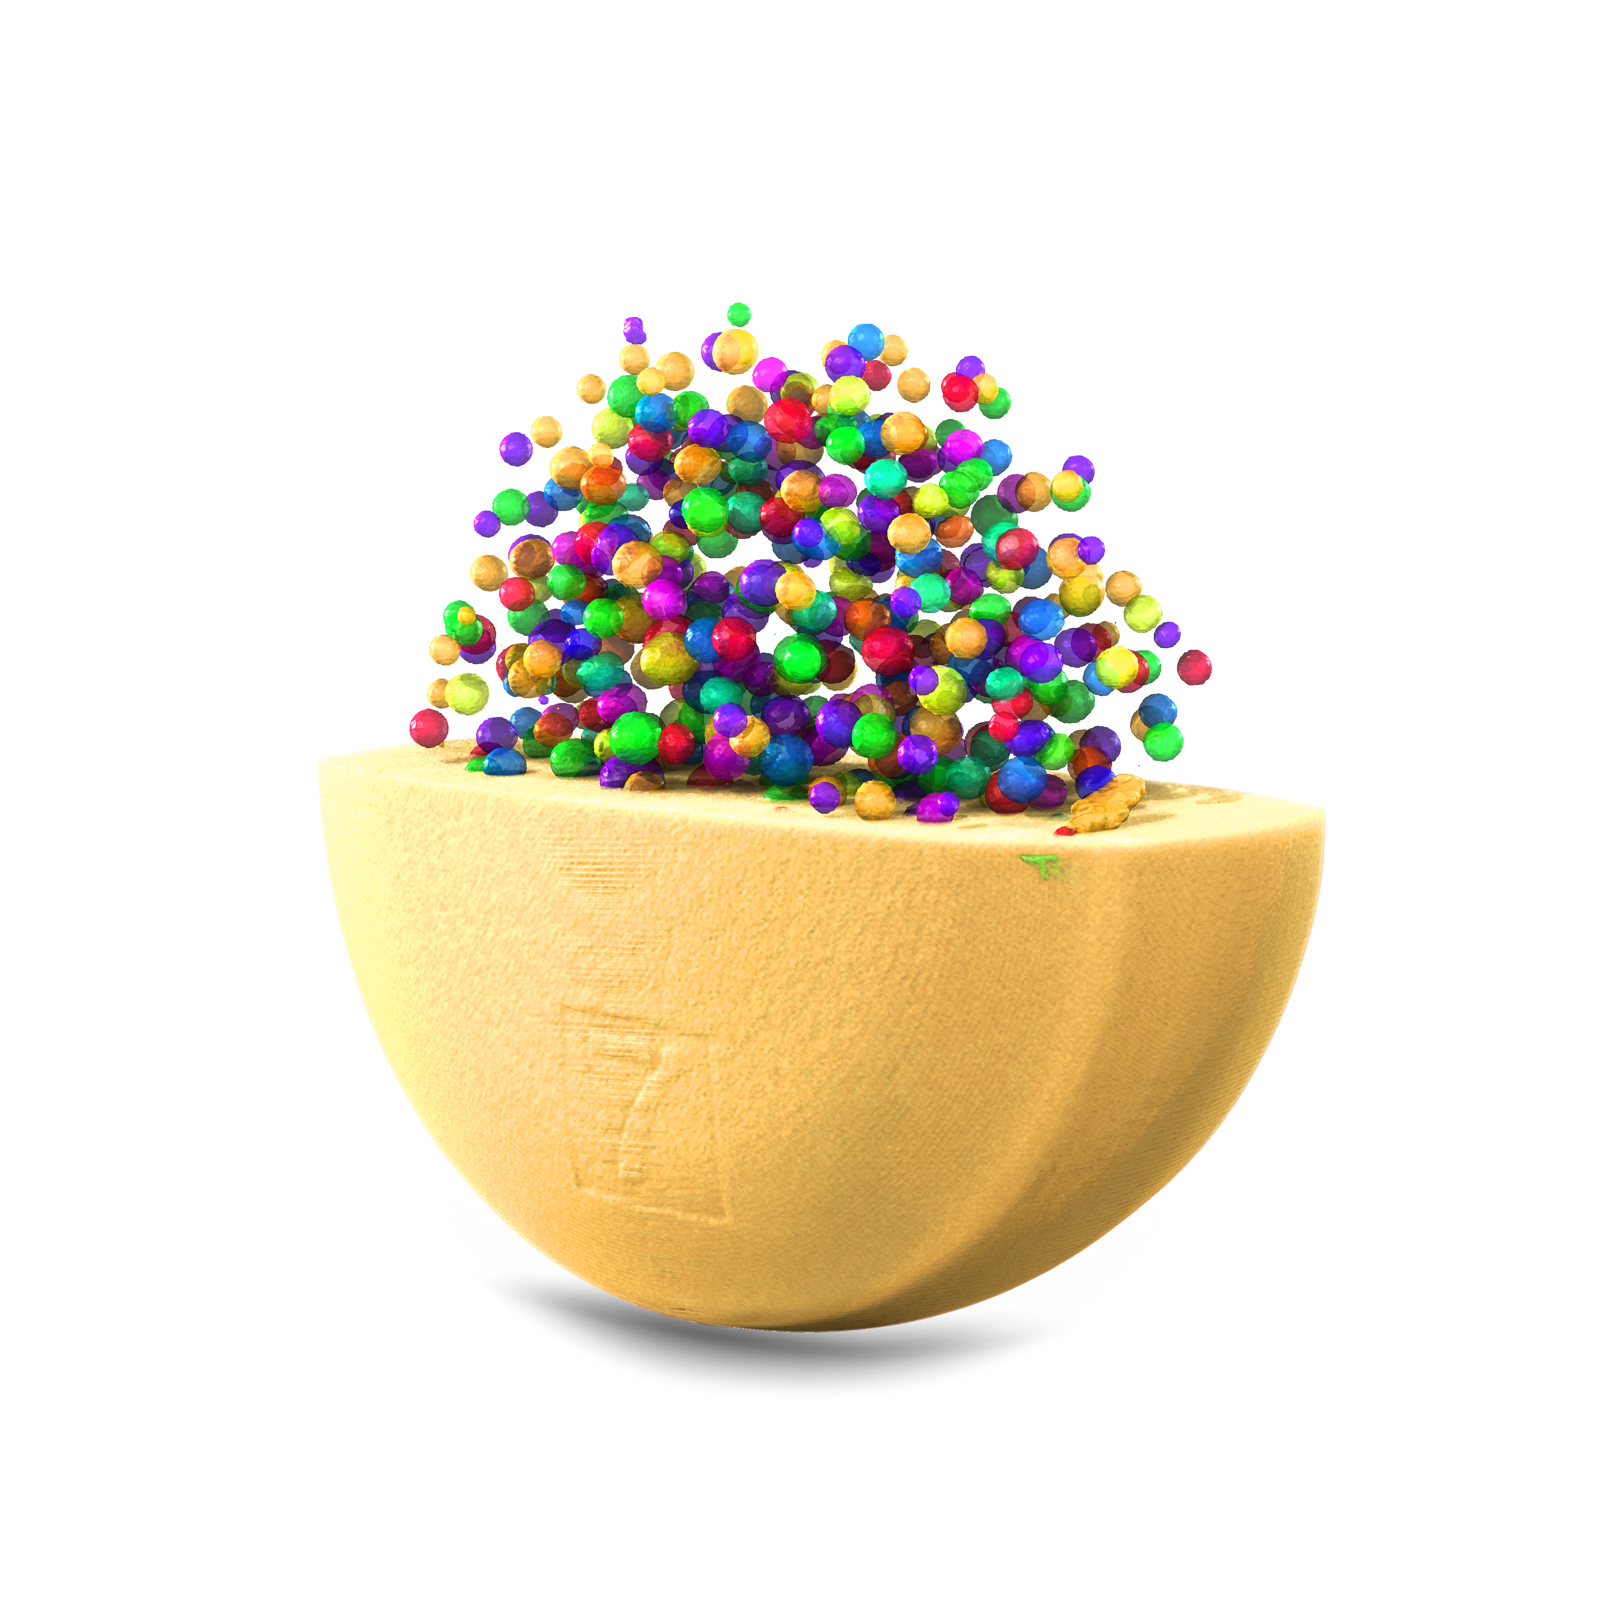
Behold, a single cheese wheel. Let your imagination run wild with pop-colored cheese holes!

Probably the most obvious
The cheese wheel reveals its innermost secrets
Take a peek inside! Bubbles: ON. Bubbles: OFF.
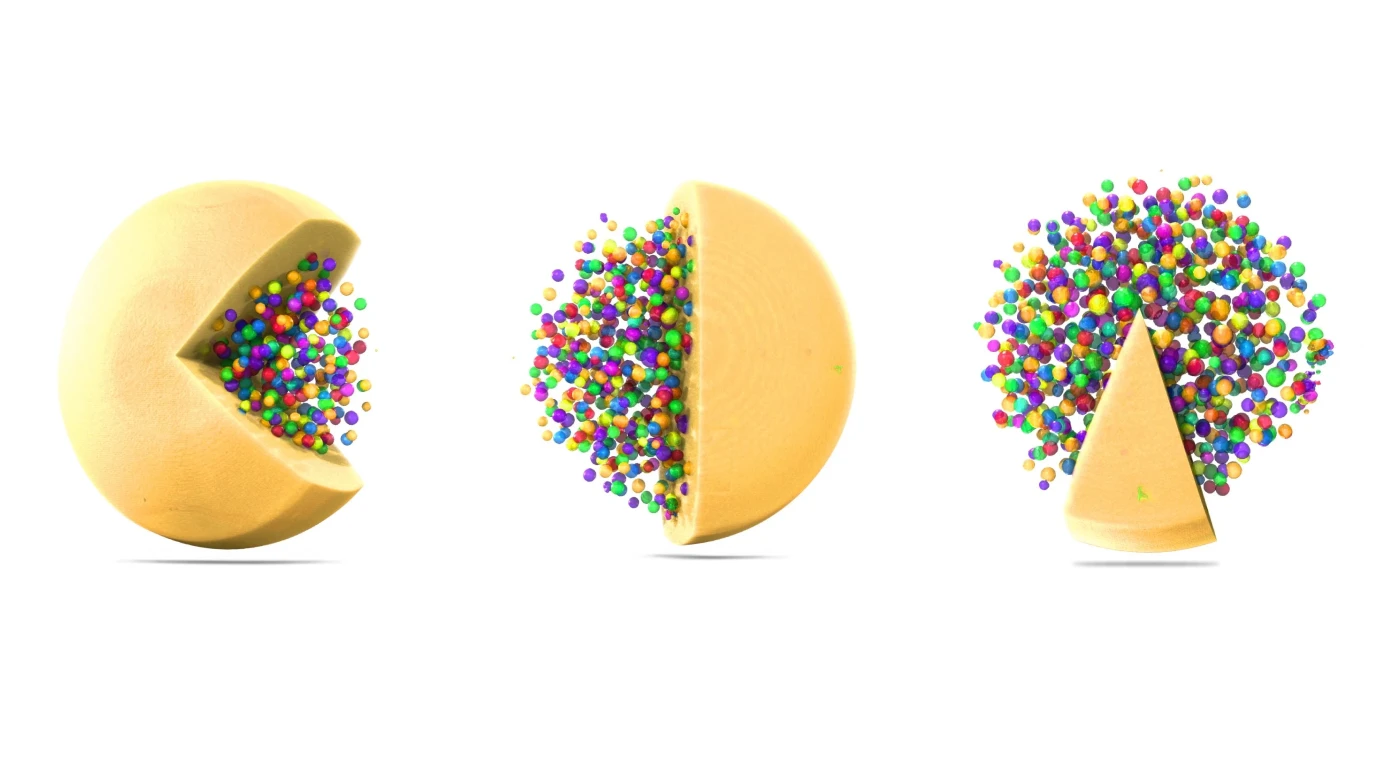
Three cheese wheels sliced with nifty virtual tools
Recreate certain video game characters, a jellyfish or … a Ferris wheel
Another animated version of the comparison
One more
Did You Know: Scaling ROIs
If you're already playing with food (in the purely virtual sense, of course), we recommend checking out the "scale" tab in the transform tool, which allows you to resize ROIs in the easiest way possible.
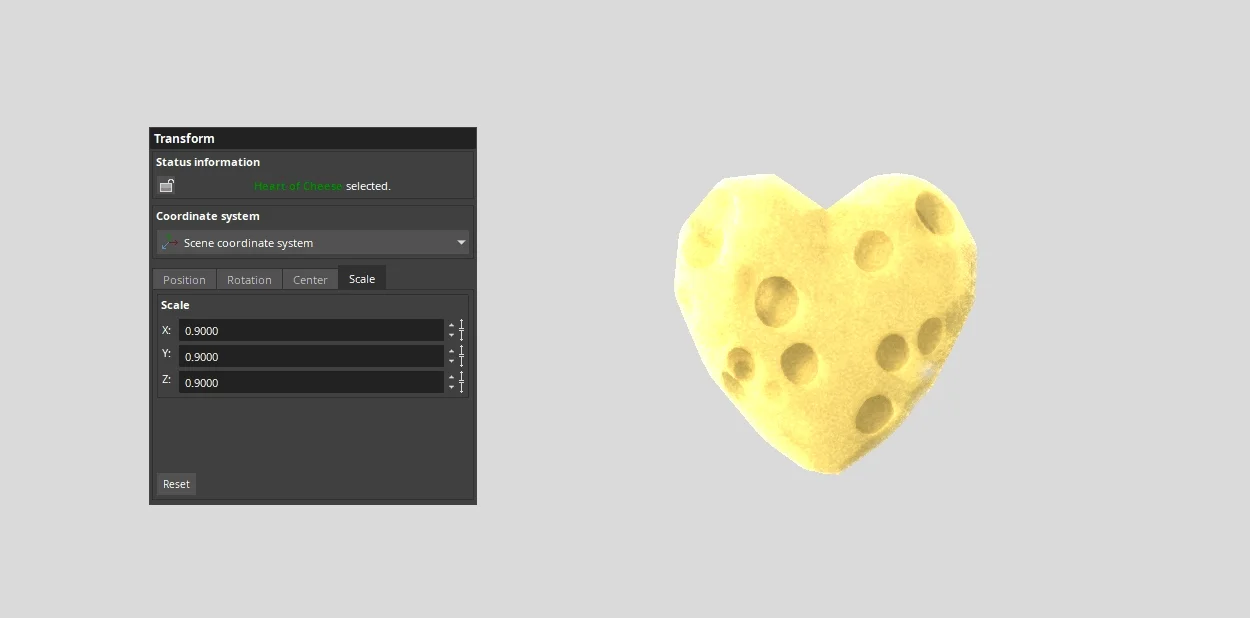
[Click to watch the heart beating}